


Urban Sky
Senior Member
Thank you so much for posting this, it is much less awkward for me if I don’t feel tempted to post such a table myself!I think I have things figured out (though it is a little kludgy). While I have great faith in you as a resource, the thing that bothered me is the following page from the VIA's presentation at the 2019 NGEC Meeting (which was after the RFQ in 2018) clearly says the corridor fleet currently has 160 cars with a total capacity of 9120 seats (between the 9,536 and 8,816 we had calculated).
View attachment 292697
I just couldn't figure out how to manipulate the numbers to get the quoted 160 cars with a total capacity of 9120 seats. It then hit me. They are saying cars not coaches. What if they are including baggage and service cars?
If you look at the cycling plan, it lists 4 types of HEP cars (H2 CO, H1 CO, H2 CL and BAG) as well as 4 types of Renaissance cars (BAG, CO, VIA1, and SERV). I assume:
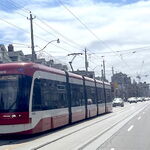
Looking at a picture of a Renaissance train I took on May 5, 2018 (below), I saw that it had 7 cars, and looking at cycling plan, that would make sense as with 2 active trains, each would have 1 Baggage car, 4 Economy Coaches, 1 Business Coach and 1 Service car, which aligns with the cycling plan. With the assumption that (as @Urban Sky said) there was (in addition to the trains in the cycling plan) also an identical reserve Renaissance train being counted, that would bring us up to 21 (not the 23 the slide above says, but close, I will get back to that later).
- H1 = HEP I,
- H2 = HEP II,
- CO = Economy Coach,
- CL (or VIA1) = Business Coach,
- BAG = Baggage, and
- SERV = Service
Continuing along in the same vain, cycling plan lists 5 HEP I Coach and 2 Baggage (which would also be HEP I ) so that is likely the 7 HEP I cars.It also lists 19 HEP II Economy and 8 HEP Business Coaches. If you (similar to Renaissance) you also add a reserve HEP II train with 4 Economy and 2 Business Coaches (a common configuration) that gets the number of HEP II cars to 33 (and matches the number of HEP II Economy class cars and Galley business cars listed on VIA's website). By doing all of this, I got the both the number of cars and the Total Capacity very close, but not quite right.
For the total capacity, the HEP I Economy class cars, can have either 60 or 62 seats. If I assume that 2 have 62 seats and 3 have 60 seats, then it works out perfectly. Or it could be that they just rounded the number to 9120, because it was divisible by 32. Either way, it is close.
As for the number of cars, VIA does have a total of 9 Renaissance baggage cars (and 3 Renaissance baggage transition cars). It is possible they assigned an extra 2 (5 instead of 3) to the Corridor fleet for some reason. That also brings the number of Renaissance cars up to 23 as claimed. It is a stretch I know, but it does make the numbers work. Any better ideas?
When you put all of this together, here is what you get:
Type Qty Capacity Total Capacity LRC Economy 71 68 4828 LRC Business 26 44 1144 LRC Total 97 5972 HEP II Coach 23 68 1564 HEP I Coach 2 62 124 HEP I Coach b 3 60 180 HEP II Club 10 56 560 HEP I Baggage 2 0 0 HEP Total 40 2428 Ren Baggage 5 0 0 Ren. Coach 12 48 576 Ren. Business 3 48 144 Ren Service 3 0 0 Ren. Total 23 720 Econ. Total 106 65.7 6968 Bus. Total 39 47.4 1848 Total 160 9120
View attachment 292746
Just two comments:
- The HEP I cars with a “Snack bar” (which is just a Galley like in the HEP II cars) are cars 8145-8147, which are used exclusively on the Jonquière and Senneterre services (to be able to offer snacks to passengers).
- There must have been a third HEP I Baggage car, to act as a back-up for the two in service (on Set 1 and Set 4).
Therefore, I can’t thank you enough for demonstrating that the size of the new fleet represents almost perfectly the “one for one” fleet replacement which was advertised, which should allow for a slight increase in seat miles, thanks to higher fleet availability and utilization...!
Last edited: