


Northern Light
Superstar
The above brings to mind a question I've wondered about.
TY for the detailed response.
Though, clearly absolute subsidy would likely have declined w/cuts to service; I'm not clear if the operating ratio of the Ocean got better or worse after the cut back, which is what I was aiming at.
So the first cut from 7-day service that was in 1990, do you know was the operating ratio was then? Service would be six days a weeks up to 2012 (from 1994), again I wonder did the operating ratio improve materially from spring 2012 to (pre-pandemic) 2020?
****
Relatedly, I know VIA had, at one point, look at a more localized Maritime service connecting the major cities of NB to Halifax.
Given the shorter distance, I don't wonder if the performance of such a route might be superior.
Not in lieu of the Ocean; but where that route is more tourism or perhaps visiting family once a year; the shorter route might have more routine utility for students, patients or perhaps, in some cases, commuters.
The nature of VIA's and Amtrak's longhaul networks is very different: Amtrak's long-distance route link many small, medium and even large relatively large cities like St Paul-Minneapolis (metropolitan population: 3.3 million), Salt Lake City (1.2 million), Dellas (2.6 million), San Antonio (2.0 million) or (via a satellite station) Phoenix (4.4 million) with the largest cities of the Nation at a reasonably fast and reliable schedule. Conversely, the Canadian links Sudbury (CMA population in the 2016 Census: 165k, rank: #24 in Canada), Winnipeg (780k, 8th), Saskatoon (295k, #17), Edmonton (1.32 million, #6) and Kamloops (105k, #36) with Toronto (5.9 million, #1) and Vancouver (2.46 million, #3) at speeds and a on-time performance which is grotesquely uncompetitive against driving, taking the plane and even taking the bus. Similarly, the Ocean links Truro (45k, #65), Moncton (145k, #29), Miramichi (28k, #99), Bathurst (31k, #88), Campbellton (16k, #127) and (at 3am in the morning) Rimouski (55k, #59) with Montreal (5.1 million, #2), Quebec City (800k, #7) and Halifax (405k, #13), though with significantly better timekeeping.
The observations from Amtrak are valid, but mostly applicable to intercity travel, for which less-than-daily travel options are not regarded as viable. However, the ridership (and especially revenues) of the Ocean and Canadian have become increasingly reliant on tourism, which happens to be a customer group which is much more forgiving about low frequencies, speeds and on-time performance.
Concerning the financial performance, if you refer back to the table I posted in Post #6,745, an operating ratio (i.e. variable revenues divided by variable expenses) of more than 130% for the Corridor services, 90-100% for the Canadian and 45-50% for the Ocean suggests that VIA's subsidy requirement would be minimized by expanding frequencies on the Corridor, keeping the Canadian where it is and reducing frequencies on the Ocean (referring to the pre-CoVid schedules of course, but leaving the question of how much more can you cut from an already thrice-weekly schedule on the Ocean):
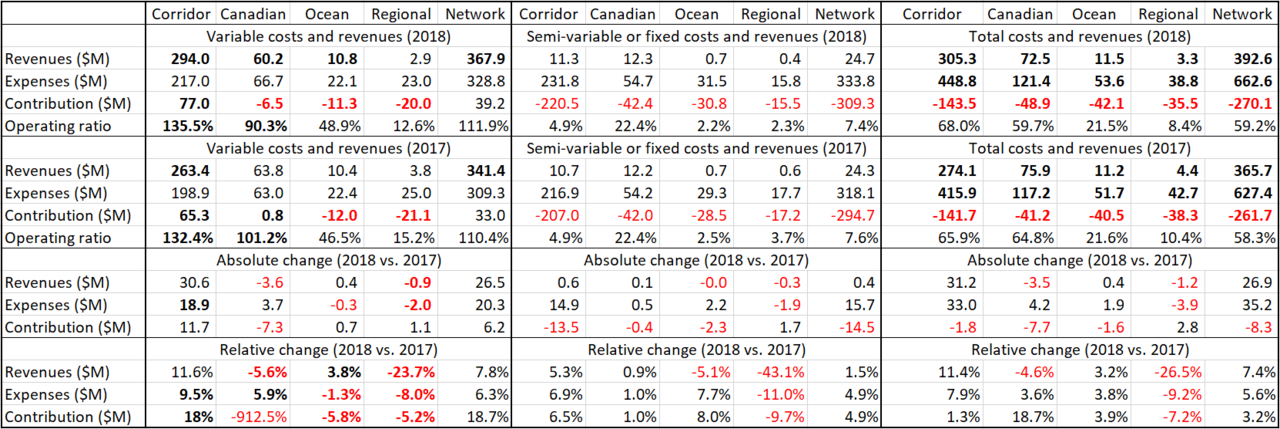
Compiled from: VIA Rail's Summary of the Corporate Plan and Annual Plans 2017 and 2018
Note: figures in bold are provided in above documents, whereas all other figures are derived from these figures.
TY for the detailed response.
Though, clearly absolute subsidy would likely have declined w/cuts to service; I'm not clear if the operating ratio of the Ocean got better or worse after the cut back, which is what I was aiming at.
So the first cut from 7-day service that was in 1990, do you know was the operating ratio was then? Service would be six days a weeks up to 2012 (from 1994), again I wonder did the operating ratio improve materially from spring 2012 to (pre-pandemic) 2020?
****
Relatedly, I know VIA had, at one point, look at a more localized Maritime service connecting the major cities of NB to Halifax.
Given the shorter distance, I don't wonder if the performance of such a route might be superior.
Not in lieu of the Ocean; but where that route is more tourism or perhaps visiting family once a year; the shorter route might have more routine utility for students, patients or perhaps, in some cases, commuters.
Last edited:
/cloudfront-us-east-1.images.arcpublishing.com/tgam/7YOKBKU4VNIXJFQZTQH6NF46WI.jpg)
