News   Jul 16, 2024
 521     0 
News   Jul 16, 2024
 546     0 
News   Jul 16, 2024
 678     2 

Toronto Crosstown LRT | ?m | ?s | Metrolinx | Arcadis

Speed limits impact travel time, and there is a real and not-negligible chance that Eglinton would have its speed limit reduced (despite your characterization as "fearmongering" and "fake bullshit".) Especially since City planning has this bizarre vision of Eglinton west as being "just like St. Clair", speed limits will likely be reduced to improve the pedestrian experience.

St. Clair has the unsigned default speed limit of 50 the last time I checked. Eglinton's is 60 but it's probably going to be dropped to 50, like the city is doing on a lot of the arterial roads in North York and Scarborough.
 
smh... turning trains back at Laird whether the line stops at Kennedy or UTSC is a bad idea...
If the Relief Line is built to Don Mills, it makes little sense to turn back half of trains at Laird too.

Ideally, if you are travelling east-bound on Eglinton to Don Mills, you don't want to worry about your train turning back at Laird.
 
The Leslie intersection is the most egregious of Eglinton planning.
But the decision was made at a time that the entire point of transit planning was to defeat Ford.
That still is an overarching theme now - 5+ years later.
 
... one thing I'm interested in, and how it relates to the line as a whole, is speed limits. If the City ever decides to lower speed limits on roads like Eglinton, will the Crosstown follow suit? Considering it's part of the traffic system and is only segregated by a small concrete curb I believe it would. With VisionZero I wouldn't be surprised to see a lowering. In effect the entire Crosstown West could see its max speed drop by 20% (60kmh->50kmh).

I estimated the difference in travel time with the 50kph limit vs 60kph limit.

Mt Dennis to Martin Grove is about 6 km. For a vehicle that doesn't make any stops, the difference in travel time is 90 seconds.

Stops make the difference even smaller, as parts of the route are covered when the train accelerates/decelerates and therefore is below the speed limit. With 8 stops in between (and maximum acceleration 2 m/s^2), the difference in travel times comes to 70 seconds.

That difference is hardly consequential. Just one poorly timed traffic signal at a major arterial can cause a longer delay than the speed limit change along the whole route.

(I didn't consider the section west of Martin Grove, that will mostly go through the highway ramps and likely not in the street median.)
 
Just one poorly timed traffic signal at a major arterial can cause a longer delay than the speed limit change along the whole route.

From the Crosstown EA Traffic Analysis

Probability of an LRT encountering delay due to yellow/red light at an intersection, under the recommended at grade scenario, AM and PM Peaks respectively
Martin Grove - 70% 62%
Kipling - 73% 65%
Islington - 55% 61%
Royal York - 69% 62%
Scarlett - 84% 84%

- Paul
Great find @crs1026. Assuming that an LRT vehicle has to stop at all of those intersections for ~2mins each, that could add up to 10 mins of travel time for passengers which is significant. Take a look at the King Street Pilot Project which has saved ~6mins of travel time to date (both ways) and those results are being called significant and successful. Additionally the recent census has found that travel times have increased by 2 mins via public transit in the past 20 years I believe and that additional time is also being described as significant.

An extra potential 10 mins of additional travel time on the Eglinton line is huge.
 
Great find @crs1026. Assuming that an LRT vehicle has to stop at all of those intersections for ~2mins each, that could add up to 10 mins of travel time for passengers which is significant. Take a look at the King Street Pilot Project which has saved ~6mins of travel time to date (both ways) and those results are being called significant and successful. Additionally the recent census has found that travel times have increased by 2 mins via public transit in the past 20 years I believe and that additional time is also being described as significant.

Yep. This is why Metrolinx recommended tunneling under some of those intersections (I believe all of them except Islington, actually)
 
Was over at Kennedy Station to get some photos of various things and saw crew paving the area where the median used to be from Kennedy Rd to the overpass. I saw at least 5 cars exit the No Frills plaza to go east with a sergeant on duty. The sergeant went over to the Metrolinx person in charge and told him about the 4 illegal crossing the road and going east he saw and stated that they must put up barriers to stop drivers from doing these illegal moves. As he was pointing to the area, we saw another 3 cars make that illegal turn. The conversation was taking almost where I was doing some shooting.

No idea what Metrolinx was going to do not only for this area, but other areas that have already been paved. Give a driver a inch and they will take a mile as well tell everyone where to go if they are doing it illegal in the first place.

They are building a new road off Eglinton to the Transitway Cres. It looks like the current on off road will be remove to allow the building of the new station. I am assuming the buses will use the Transitway road to Kennedy to get too Eglinton with this change, since I have never seen any plans for it in the first place. The new bus bays with shelters are ready to go into service as well the new traffic lights.
 
From the Crosstown EA Traffic Analysis

Probability of an LRT encountering delay due to yellow/red light at an intersection, under the recommended at grade scenario, AM and PM Peaks respectively
Martin Grove - 70% 62%
Kipling - 73% 65%
Islington - 55% 61%
Royal York - 69% 62%
Scarlett - 84% 84%

- Paul

Great find @crs1026. Assuming that an LRT vehicle has to stop at all of those intersections for ~2mins each, that could add up to 10 mins of travel time for passengers which is significant. Take a look at the King Street Pilot Project which has saved ~6mins of travel time to date (both ways) and those results are being called significant and successful. Additionally the recent census has found that travel times have increased by 2 mins via public transit in the past 20 years I believe and that additional time is also being described as significant.

An extra potential 10 mins of additional travel time on the Eglinton line is huge.

Yep. This is why Metrolinx recommended tunneling under some of those intersections (I believe all of them except Islington, actually)

These are the average delay for trips on Crosstown West based on the selected designs in the EA that @crs1026 posted:

AM Peak:

Martin Grove (Scenario 2): 31.2 Seconds

Kipling (Scenario 5): 25.7 Seconds

Islington (Scenario 2): 15.2 seconds

Royal York (Scenario 2): 23.4 seconds

Scarlett Road (Scenario 2): 33.8 seconds

Jane Street (Scenario 3): 30 seconds

Total AM Peak average delay: 159.3 seconds = 2 min 39 seconds


PM Peak:

Martin Grove (Scenario 2): 25 Seconds

Kipling (Scenario 5): 21.1 Seconds

Islington (Scenario 2): 13.6 seconds

Royal York (Scenario 2): 21.2 seconds

Scarlett Road (Scenario 2): 33.8 seconds

Jane Street (Scenario 3): 29.9 seconds

Total PM Peak average delay: 135.5 seconds = 2 mins 15 seconds

Anticipated travel times between Jane and Renforth is 15.4 minutes, or 924 seconds, based on the Transit City design (17 stops). The delays due to the six signalized intersection represents 14.6% of this travel time.

For reference, I've compiled to cost of grade separating each intersection, and the potential time savings in the AM peak.

The Jane Street grade separation appears to provide the best value for transit riders by far, although I'd still have a hard time supporting it given that the absolute value of the time savings are so low.

AM Peak:

Jane Street (Scenario 3): 30 seconds
Cost: Between $70.5 and $106 Million
$2.35 Million/second to $3.53 Million/second

Scarlett Road (Scenario 2): 33.8 seconds

Cost: Between $93.1 and $139.6 million
$2.78 Million/second to $4.17 Million/second

Islington (Scenario 2): 15.2 seconds
Cost: Between $74 and $111.3 million
$4.87 Million/second to $7.32 million/second


Martin Grove (Scenario 2): 31.2 sec saved

Cost: Between $236.5 and $354.9 million
$7.58 Million/second to $11.35 Million/second

Royal York (Scenario 2): 23.4 seconds
Cost: Between $187.1 and $280.8 million
$8.10 Million/second to $12.0 Million/second

Kipling (Scenario 5): 25.7 Seconds
Cost: Between $220.6 and $331 million
$8.68 Million/second to $13.03 Million/second
 
These are the average delay for trips on Crosstown West based on the selected designs in the EA that @crs1026 posted:

AM Peak:

Martin Grove (Scenario 2): 31.2 Seconds

Kipling (Scenario 5): 25.7 Seconds

Islington (Scenario 2): 15.2 seconds

Royal York (Scenario 2): 23.4 seconds

Scarlett Road (Scenario 2): 33.8 seconds

Jane Street (Scenario 3): 30 seconds

Total AM Peak average delay: 159.3 seconds = 2 min 39 seconds


PM Peak:

Martin Grove (Scenario 2): 25 Seconds

Kipling (Scenario 5): 21.1 Seconds

Islington (Scenario 2): 13.6 seconds

Royal York (Scenario 2): 21.2 seconds

Scarlett Road (Scenario 2): 33.8 seconds

Jane Street (Scenario 3): 29.9 seconds

Total PM Peak average delay: 135.5 seconds = 2 mins 15 seconds

Anticipated travel times between Jane and Renforth is 15.4 minutes, or 924 seconds, based on the Transit City design (17 stops). The delays due to the six signalized intersection represents 14.6% of this travel time.

I was no fan of City Planning's decision not to grade separate any of these intersections. But given the data in the EA, I can understand why they came to that conclusion

Take Scarlett Road for example. Grade separating that intersection would add $93.1 Million to $140 Million, to save passengers just 33.8 seconds of travel time. Then consider that many passengers walking from the Southside of Eglinton Avenue West would have to cross Eglinton Avenue and then climb up a flight of stairs; this means that for a significant portion of passengers, the increased time spent entering the station will negate much of the total travel time benefit that grade separation supposedly introduces.

Overall I would expect grade separation to result in a net decrease in travel time for all passengers, but given the cost and the relatively minimal time delay at these signalized intersections, I now have strong reservations about whether or not grade separation at intersections provides good value for money.

Costs of up to $1.3 Billion to save about 2.5 minutes for the subset of customers that happen to be travelling the full route between Martin Grove and Jane is a very tough sell for me.

Further, if we weighted average travel values based on anticipated ridership at each individual stop, the total travel time savings per passenger per trip would be substantially lower than the 2.5 Minutes for the entire length between Martin Grove and Jane.
 
Quit frankly, grade separation for high speed trains is a must, but for local transit it not. The cost to save 2-3 minutes of real travel time not factoring in the extra time to get to/from these grade separation stations out weight the cost of having a station at grade. Then there is the extra cost to maintain these stations vs the grade stations. How often do you see notices of elevators or escalators out of service and what is the cost to fix them?? Any able body can use the stairs, but we are in an aging cycle, as well providing service to the accessibility community. These must be factor in when doing comparison.

Point of example, Victoria Park Eastbound elevator is out of service at this time. This means with luck, the accessibility rider only has to go to Warden to do a cross platform change to catch a westbound train to go back to Victoria to get off where they wanted to do in the first place. How much extra time does that add to a rider travel time?? An accessibility rider come in many forms, not just scooter. If Warden wasn't a centre platform with no elevator, the rider would have to go to Kennedy to do the back tracking. If both elevators were out at Victoria, the rider would have to take the Eglinton bus to Victoria and do a bus change to get to where they were going in the first place.

Oncer again, we must please the car drivers, along with the industries that put these things on the road daily so they can make a buck.
 
Further, if we weighted average travel values based on anticipated ridership at each individual stop, the total travel time savings per passenger per trip would be substantially lower than the 2.5 Minutes for the entire length between Martin Grove and Jane.

Here is the ridership at each station, from the Transit City EA:

Screen Shot 2017-12-08 at 12.48.50 AM.png


Lets weight the cost of grade separation, with the ridership at each stop and potential time savings: This is cost per minute saved per passenger.

The cost effectiveness of grade separation of intersections gets progressively worse as we travel west on on LRT. Jane Street grade separation performs best, at a cost of $618 per second per passenger to $929 per second per passenger. Martin Grove performs worst at $3,225 per second per passenger to $4,829 per second per passenger.

City Council is going to have to decide if they're willing to spend so much money, for a relatively small impact on travel times. Personally, I don't believe I'm willing to continue supporting any of these grade separations. $106 Million to save 30 seconds is a very steep price - and that's for the best performing of all the grade separations.

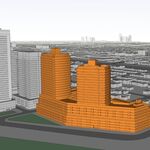
100% grade separation, whether that be elevated or tunnelled, would also provide terrible value for money, considering that would save only 2.5 minutes on the trip time.

Jane: Time savings of 30 seconds with 3,800 AM peak passengers at a cost of between $70.5 and $106 Million
$618 per second per passenger to $929 per second per passenger

Scarlett Road: Time savings of 33.8 seconds with 3,300 AM peak passengers at a cost of between $187.1 and $280.8 million
$842 per second per passenger to $1263 per second per passenger

Royal York: Time savings of 23.4 seconds with 3,300 AM peak passengers at a cost of between $93.1 and $139.6 million
$2,454 per second per passenger to $3,636 per second per passenger

Islington: Time savings of 15.2 seconds with 3,100 AM peak passengers at a cost of between $74 and $111.3 million
$1,570 per second per passenger to $2,361 per second per passenger

Kipling: Time savings of 25.6 seconds with 2,700 AM peak passengers at a cost of between$220.6 and $331 million
$3,214 per second per passenger to $4,814 per second per passenger

Martin Grove: Time savings of 31.2 seconds with 2,350 AM peak passengers at a cost of between $70.5 and $106 Million
$3,225 per second per passenger to $4,829 per second per passenger
 

Attachments

  • Screen Shot 2017-12-08 at 12.48.50 AM.png
    Screen Shot 2017-12-08 at 12.48.50 AM.png
    409.9 KB · Views: 422
Last edited:

Back
Top