Putting methodological issues aside (e.g. proportion of crime being reported, etc) - I think using homicide alone is a poor proxy of "crime" - it is the most visible but often irrelevant indicator. I'd be more concerned about things like changes in proportion of criminal acts committed with use of weapons; proportion of unsolved crimes; proportion of crimes committed by repeat offenders, etc.
AoD
A lot of that is available at the link I provided:
The Toronto Police Service Public Safety Data Portal provides police open data, data analytic and web map applications to the public to improve the understanding of policing, improve transparency and enhance confidence through open data.
data.torontopolice.on.ca
If you click through, these are your options:
In general, the stats provided are solid give you 5 years of history to compare.
One limitation, however is they don't include rates per capita, so a climb in numbers, when population is also rising should really be adjusted.
Also there is no indexing feature for 'Theft Over'.
The MCI summary looks like this:
All numbers are year to date, as per the date in the bottom right hand corner. The previous year data is adjusted to the identical date.
The 10-year version is under Historical and is not updated as frequently.
Looking at the 10-year, I'll use the global numbers (lower left) to show 'rate'
2014 - 32,461 - population 2,800,000 - Rate: 1,159 per 100,000 people
2024 - 47, 308 - population 3,200,000 - Rate 1,478 per 100,000
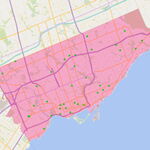
Here's Shootings/Firearm discharged - 5-year:
So the above shows we are pacing for about 260 or so for full year. Based on the below, that would be the lowest since 2015. When factoring in population growth its historically near the bottom.