|
|
|


You are using an out of date browser. It may not display this or other websites correctly.
You should upgrade or use an alternative browser.
You should upgrade or use an alternative browser.
Commercial Real Estate- all things related to commercial real estate in GTA
- Thread starter Davidackerman
- Start date
Davidackerman
Active Member
Davidackerman
Active Member
Downtown Office and Greater Toronto Area Industrial Markets Feel the Same Pain Companies seeking space in these markets are paying a high price, exploring “plan-b” options, or holding off. Broker insights are more crucial than ever.
While vastly different, the downtown office and Greater Toronto Area (GTA) industrial markets are grappling with the same issues: record-low availability, soaring rents, and incredibly relentless demand.
These challenging conditions are the “number one” topic at our weekly broker meetings. We go around the table to get a handle on any space coming to market, off-market vacancy, rapidly changing market dynamics, and competitive offers.

Record Growth Cycle: This growth cycle is well into its ninth year. What’s really incredible is the sustained demand strength that continues to lap up any office and industrial supply that comes available. Supply can’t keep up. Our veterans have seen many cycles, but never one quite like this. The number of office-using jobs continues to grow as more companies locate downtown – and this is putting pressure on housing availabilities and prices.
In such red-hot conditions, the “intel” offered to clients by our teams is critical. It gives tenants on the street a better shot at landing the off-market space, even if it’s their “plan b”. It comes down to who knows what, creative solutions, and acting fast.
Downtown Office Focus: Relief by 2020?
Did you know the Toronto’s Downtown Office market is the second fast-growing in North America? This gives you an idea of the magnitude of this growth cycle. Incredibly, in spite of non-stop development since 2009, it also has the lowest availability rate!
Unabated Momentum: In the first quarter of 2018, over 190,000 square feet (sf) was absorbed by new and expanding tenants. Availability fell to yet a new record low of 2.4%.
Five Blocks of Space — Count ’em! Across the entire downtown market, encompassing 74 million square feet (msf), there are only five blocks of space over 50,000 sf for tenants looking to occupy in 2018.
“No Vacancy”: The Downtown West submarket availability rate is at a staggering low of 1.3%. In fact, three of downtown’s six submarkets have availability rates below the 2% mark. Companies seeking space in these markets need a miracle (or a Cushman & Wakefield broker) to get in.
How Long Can This Last? Our brokers don’t see an end in sight for this year. Tech entrants, the continuing transformation of organizations across sectors, and the rise of e-com and logistics continue to drive demand. Tight market conditions and higher rental rates will be the story until new office supply relief arrives in 2020-2024. On the industrial side, the horizon isn’t so rosy.
GTA Industrial: No Relief in Sight
The sheer velocity of demand and lack of supply across GTA industrial markets have driven rental rates up by 9.3% — the highest year-over-year increase on record. Demand, coming mostly from warehouse and distribution sectors, shows no sign of abating as online shopping continues to transform retail and other businesses.
Remarkably, industrial availability sits at 2.2% – the lowest in history.
A top-of-mind question for brokers today is: With the market so tight and getting tighter, where will the space come from to do deals next year? Supply cannot manage current demand. Further, rising land costs and a dire shortage of land are huge stumbling blocks to providing relief.
For their part, users are feeling sticker shock. Given the lack of product, owners of larger buildings (100,000 sf-plus) are starting to take a wait-and-see approach to renewals, as they see continued upward pressure on rental rates.
In this market, our brokers are being challenged to educate tenants on today’s realities, while helping with creative solutions to meet urgent requirements. The bottom line is that users must act fast to secure any space that comes to market or risk losing it to another user standing in line.
Coping Strategies: Increasingly, industrial tenants are looking at creating new efficiencies within their existing operations to reduce their footprint. Others are actively exploring options in secondary markets where they can find space, while reducing occupancy costs.
So, at first glance, the GTA industrial and downtown office optics look the same. Insatiable demand and severely limited options are shared challenges. That stark difference is relief — there’s not enough on the industrial horizon.
Summing up, 2018 will be no a picnic for downtown office and GTA industrial tenants – and 2019 will be much the same. If there’s any consolation, it’s that Toronto is one of the world’s great cities with a growing population and bright future. It’s worth the battle for companies to locate in both markets to capitalize on changing customer demands and win the fight for talent.
Juana Sue-A-Quan is Research Market Director for the Greater Toronto Area. In this role, Juana leads the research teams and initiatives across all three GTA offices, delivering industry leading insights and thought leadership to our leasing professionals and clients.
—
While vastly different, the downtown office and Greater Toronto Area (GTA) industrial markets are grappling with the same issues: record-low availability, soaring rents, and incredibly relentless demand.
These challenging conditions are the “number one” topic at our weekly broker meetings. We go around the table to get a handle on any space coming to market, off-market vacancy, rapidly changing market dynamics, and competitive offers.
Record Growth Cycle: This growth cycle is well into its ninth year. What’s really incredible is the sustained demand strength that continues to lap up any office and industrial supply that comes available. Supply can’t keep up. Our veterans have seen many cycles, but never one quite like this. The number of office-using jobs continues to grow as more companies locate downtown – and this is putting pressure on housing availabilities and prices.
In such red-hot conditions, the “intel” offered to clients by our teams is critical. It gives tenants on the street a better shot at landing the off-market space, even if it’s their “plan b”. It comes down to who knows what, creative solutions, and acting fast.
Downtown Office Focus: Relief by 2020?
Did you know the Toronto’s Downtown Office market is the second fast-growing in North America? This gives you an idea of the magnitude of this growth cycle. Incredibly, in spite of non-stop development since 2009, it also has the lowest availability rate!
Unabated Momentum: In the first quarter of 2018, over 190,000 square feet (sf) was absorbed by new and expanding tenants. Availability fell to yet a new record low of 2.4%.
Five Blocks of Space — Count ’em! Across the entire downtown market, encompassing 74 million square feet (msf), there are only five blocks of space over 50,000 sf for tenants looking to occupy in 2018.
“No Vacancy”: The Downtown West submarket availability rate is at a staggering low of 1.3%. In fact, three of downtown’s six submarkets have availability rates below the 2% mark. Companies seeking space in these markets need a miracle (or a Cushman & Wakefield broker) to get in.
How Long Can This Last? Our brokers don’t see an end in sight for this year. Tech entrants, the continuing transformation of organizations across sectors, and the rise of e-com and logistics continue to drive demand. Tight market conditions and higher rental rates will be the story until new office supply relief arrives in 2020-2024. On the industrial side, the horizon isn’t so rosy.
GTA Industrial: No Relief in Sight
The sheer velocity of demand and lack of supply across GTA industrial markets have driven rental rates up by 9.3% — the highest year-over-year increase on record. Demand, coming mostly from warehouse and distribution sectors, shows no sign of abating as online shopping continues to transform retail and other businesses.
Remarkably, industrial availability sits at 2.2% – the lowest in history.
A top-of-mind question for brokers today is: With the market so tight and getting tighter, where will the space come from to do deals next year? Supply cannot manage current demand. Further, rising land costs and a dire shortage of land are huge stumbling blocks to providing relief.
For their part, users are feeling sticker shock. Given the lack of product, owners of larger buildings (100,000 sf-plus) are starting to take a wait-and-see approach to renewals, as they see continued upward pressure on rental rates.
In this market, our brokers are being challenged to educate tenants on today’s realities, while helping with creative solutions to meet urgent requirements. The bottom line is that users must act fast to secure any space that comes to market or risk losing it to another user standing in line.
Coping Strategies: Increasingly, industrial tenants are looking at creating new efficiencies within their existing operations to reduce their footprint. Others are actively exploring options in secondary markets where they can find space, while reducing occupancy costs.
So, at first glance, the GTA industrial and downtown office optics look the same. Insatiable demand and severely limited options are shared challenges. That stark difference is relief — there’s not enough on the industrial horizon.
Summing up, 2018 will be no a picnic for downtown office and GTA industrial tenants – and 2019 will be much the same. If there’s any consolation, it’s that Toronto is one of the world’s great cities with a growing population and bright future. It’s worth the battle for companies to locate in both markets to capitalize on changing customer demands and win the fight for talent.
Juana Sue-A-Quan is Research Market Director for the Greater Toronto Area. In this role, Juana leads the research teams and initiatives across all three GTA offices, delivering industry leading insights and thought leadership to our leasing professionals and clients.
—
Attachments
Davidackerman
Active Member
New information on growing Industrial construction- It's from a newsletter from the influential tracker of the Industrial Biz
HOW MUCH IS MY BUILDING REALLY WORTH?
Establishing True Valuations Across Different Markets and Building Types Across the GTA - Part 1
January 18th, 2019
At this time of year, every brokerage comes out with their Market Stats, an overview of 2018, as well as the Outlook for 2019. In essence, they are looking back to be able to predict the future.
So here it is: Market Stats for the Greater Toronto Area - Q4 2018

Q4 2018 Market Stats - Credit: Cushman & Wakefield ULC
GTA Overall Vacancy Rates
Vacancy rates in the Greater Toronto Area plummeted to 1.5% of the overall inventory - a new historical low. Just one year ago, vacancy rates were at 2.4%.
Based on the supply of new properties and unprecedented demand, we expect vacancy at even lower rates by the end of the first quarter of 2019. Vacancy rates for leasing are at about 1.4% while only 800,000 SF of the overall inventory in GTA is available for sale - or to put that into perspective, just a staggering 0.1%.
GTA Average Net Rent
All of the above has caused the GTA average net rent to climb to $7.40 PSF, again, a new historical high. As it continues on its upward trajectory we can expect even higher net rental rates.
GTA Development Pipeline
In 2018, developers in the Greater Toronto Area produced 6.3 Million SF of new buildings. With absorption of over 9.5 million, and given the gap of about 3.2 Million SF, it is no surprise as to why net rental rates are on the rise. This has caused a lot of capital to move into the arena and accelerate construction of new product, reaching a rate of 9.5 Million SF at the end of 2018.

Q4 2018 Market Stats - Credit: Cushman & Wakefield ULC
GTA Property Values
With vacancy rates for sale being only about 0.1%, the WTD Average sale price in the Greater Toronto Area climbed to $193.58 PSF.
Being able to understand general trends is great, but you may be asking yourself…
“How much is my property really worth?”
What rental rate can I expect? How much PSF would I be able to get if I sold my building?
These questions are being asked all the time. Well, it depends on many factors, including the age and size of the building, lot size, ceiling height, office component, parking, trucking access, truck parking if available, etc….
In order to get to the truth, we need to dig a bit deeper in each submarket.
So let’s start this week with our first submarket profile.
Toronto Central (Toronto, North York, York, East York) Markets
Properties Sold in 2018, Size Range 20,000 - 50,000 SF
AddressBuilding Size
(SF)Lot Size
(Acres)PricePrice PSFCap RateDate
401 Norfinch Drive20,8001.196$3,650,000 $175 n/aOctober 1, 2018
98 Arrow Road21,0001.312$2,800,000 $133 5.00%June 20, 2018
24 Martin Ross Avenue21,0501.103$4,483,500 $213 n/aMay 31, 2018
88 - 98 Arrow Road21,8501.312$3,750,000 $172 3.70%November 1, 2018
99 Sunrise Avenue22,0901.124$3,850,000 $174 n/aApril 19, 2018
30 High Meadow Place22,8003.25$7,775,000 $341 5.30%March 19, 2018
1001 Petrolia Road23,0001.472$5,400,000 $235 n/aSeptember 20, 2018
445 Eddystone Avenue23,8501.072$3,750,000 $157 n/aNovember 1, 2018
4455 Chesswood Drive25,7500.125$4,350,000 $169 n/aJuly 16, 2018
129 - 151 Turbine Drive26,2401.53$2,850,000 $109 5.10%February 9, 2018
25 Sheffield Street28,9011.839$3,750,000 $130 n/aFebruary 15, 2018
499 - 501 Garyray Drive31,0001.682$4,450,000 $144 n/aJanuary 12, 2018
64 Eddystone Avenue37,6862.088$4,732,000 $126 5.30%July 3, 2018
126 Tycos Drive42,7921.96$10,000,000 $234 n/aNovember 28, 2018
150 Milvan Drive47,2502.125$6,000,000 $127 n/aMay 9, 2018
In 2018, a total of 15 properties between 20,000 - 50,000 SF were sold. The prices achieved were in the rage of $109 - $341 PSF, with an average building size of 27,737 SF and an average price of $175 PSF.

555 Oakdale Road, Toronto
Toronto Central (Toronto, North York, York, East York) Markets
Properties Sold in 2018, Size Range 50,000 - 100,000 SF
AddressBuilding Size
(SF)Lot Size
(Acres)PricePrice PSFCap RateDate
125 Tycos Drive51,4003.053$13,621,000 $265 n/aJuly 10, 2018
133 Bridgeland Avenue52,0002.981$9,100,000 $175 n/aJuly 6, 2018
430 Flint Road55,7002.371$6,750,000 $121 n/aFebruary 28, 2018
555 Oakdale Road60,7473.007$6,575,000 $108 4.60%May 1, 2018
20 Overlea Boulevard66,3373.1$10,800,000 $163 n/aFebruary 8, 2018
50 Dufflaw Road67,5002.578$7,375,000 $109 n/aJune 28, 2018
Further, in 2018, a total of 6 properties between 50,000 - 100,000 SF were sold. Prices achieved were from $108 - $265 PSF, with an average building size of 58,947 SF and an average price of $157 PSF.

150 Milvan Drive, Toronto
Toronto Central (Toronto, North York, York, East York) Markets
Properties Sold in 2018, Size Range 100,000 SF plus
AddressBuilding Size
(SF)Lot Size
(Acres)PricePrice PSFCap RateDate
835 York Mills Road113,3503.54$8,000,000 $71 n/aMay 22, 2018
600 Clayson Road136,0776.005$10,600,000 $78 n/aMarch 12, 2018
724 Caledonia Road136,5007.19$7,000,000 $51 n/aJanuary 15, 2018
When looking at properties larger than 100,000 SF, a total of 3 sold in 2018. Prices achieved were from $51 - $78 PSF, with an average building size of 128,642 SF and an average price of $66.67 PSF.

724 Caledonia Road, Toronto
Toronto Central (Toronto, North York, York, East York) Markets
Properties Leased in 2018, Size Range 20,000 - 50,000 SF
AddressBuilding Size (SF)CeilingNet RentDate Leased
36 Milvan Dr22,76614$6.00 October 31, 2018
35 Oak Street 24,19213' 8"$3.95*September 25, 2018
103 Brisbane Rd24,20914$4.50 November 16, 2018
5 Sheffield Street 26,25118$5.95*May 10, 2018
5777 Steeles Avenue West28,92018$5.75*May 10, 2018
220-260 Lesmill Road33,33315' 8" $5.25March 23, 2018
585 Canarctic Dr36,85616$6.50 August 20, 2018
98 Norfinch Dr38,16625$6.75 April 5, 2018
601 Gordon Baker Rd38,40018$6.10 November 27, 2018
100 Toryork Dr43,00014$5.50 November 1, 2018
124 Bermondsey Rd43,15021$8.15 June 25, 2018
233 Signet Drive49,86120$6.25*July 13, 2018
350-358 Flint Road 50,00022' 6"$5.50 September 28, 2018
Asking Net Rental Rates*
On the leasing side, a total of 13 properties between 20,000 - 50,000 SF were leased in 2018. The net rental rates achieved were from $3.95 - $8.15 PSF, with an average building size of 35,315 SF and an average net rental rate of $5.10 PSF.

585 Canarctic Drive, Toronto
Toronto Central (Toronto, North York, York, East York) Markets
Properties Leased in 2018, Size Range 50,000 - 100,000 SF
AddressBuilding Size (SF)CeilingNet RentDate Leased
350-358 Flint Road 50,00022' 6"$5.50 September 28, 2018
401 Clayson Rd51,38720$5.95*October 23, 2018
188 Cartwright Avenue60,00016TBCMay 9, 2018
140 Wendell Avenue 70,00015-20$5.50 February 14, 2018
2 Hallcrown Place70,00024$5.95*February 1, 2018
Asking Net Rental Rates*
A total of 5 properties between 50,000 - 100,000 SF were leased in 2018. The net rental rates achieved ranged from $5.50 - $5.95 PSF, with an average size of a building being 60,277 SF and an average net rental rate of $5.58 PSF.

188 Cartwright Avenue, Toronto
Toronto Central (Toronto, North York, York, East York) Markets
Properties Leased in 2018, Size Range 100,000 SF plus
AddressBuilding Size (SF)CeilingNet RentDate Leased
2239 Sheppard Ave W101,15132$7.25 August 31, 2018
2243 Sheppard Avenue West183,77732$6.85*August 16, 2018
2233 Sheppard Ave W290,67636$7.25 August 31, 2018
2233 Sheppard Ave W544,57236$6.95 March 2, 2018
Asking Net Rental Rates*
Lastly, a total of 4 properties larger than 100,000 SF were leased in 2018. The net rental rates achieved ranged from $6.85 - $7.25 PSF, with an average building size 280,044 SF and an average net rental rate of $7.08 PSF.

2233 Sheppard Avenue West, Toronto
Goran Brelih, SIOR
Senior Vice President, Broker
Cushman & Wakefield ULC, Brokerage.
www.cushmanwakefield.com
President, SIOR - Central Canada Chapter
www.siorccc.org
HOW MUCH IS MY BUILDING REALLY WORTH?
Establishing True Valuations Across Different Markets and Building Types Across the GTA - Part 1
January 18th, 2019
At this time of year, every brokerage comes out with their Market Stats, an overview of 2018, as well as the Outlook for 2019. In essence, they are looking back to be able to predict the future.
So here it is: Market Stats for the Greater Toronto Area - Q4 2018
Q4 2018 Market Stats - Credit: Cushman & Wakefield ULC
GTA Overall Vacancy Rates
Vacancy rates in the Greater Toronto Area plummeted to 1.5% of the overall inventory - a new historical low. Just one year ago, vacancy rates were at 2.4%.
Based on the supply of new properties and unprecedented demand, we expect vacancy at even lower rates by the end of the first quarter of 2019. Vacancy rates for leasing are at about 1.4% while only 800,000 SF of the overall inventory in GTA is available for sale - or to put that into perspective, just a staggering 0.1%.
GTA Average Net Rent
All of the above has caused the GTA average net rent to climb to $7.40 PSF, again, a new historical high. As it continues on its upward trajectory we can expect even higher net rental rates.
GTA Development Pipeline
In 2018, developers in the Greater Toronto Area produced 6.3 Million SF of new buildings. With absorption of over 9.5 million, and given the gap of about 3.2 Million SF, it is no surprise as to why net rental rates are on the rise. This has caused a lot of capital to move into the arena and accelerate construction of new product, reaching a rate of 9.5 Million SF at the end of 2018.
Q4 2018 Market Stats - Credit: Cushman & Wakefield ULC
GTA Property Values
With vacancy rates for sale being only about 0.1%, the WTD Average sale price in the Greater Toronto Area climbed to $193.58 PSF.
Being able to understand general trends is great, but you may be asking yourself…
“How much is my property really worth?”
What rental rate can I expect? How much PSF would I be able to get if I sold my building?
These questions are being asked all the time. Well, it depends on many factors, including the age and size of the building, lot size, ceiling height, office component, parking, trucking access, truck parking if available, etc….
In order to get to the truth, we need to dig a bit deeper in each submarket.
So let’s start this week with our first submarket profile.
Toronto Central (Toronto, North York, York, East York) Markets
Properties Sold in 2018, Size Range 20,000 - 50,000 SF
AddressBuilding Size
(SF)Lot Size
(Acres)PricePrice PSFCap RateDate
401 Norfinch Drive20,8001.196$3,650,000 $175 n/aOctober 1, 2018
98 Arrow Road21,0001.312$2,800,000 $133 5.00%June 20, 2018
24 Martin Ross Avenue21,0501.103$4,483,500 $213 n/aMay 31, 2018
88 - 98 Arrow Road21,8501.312$3,750,000 $172 3.70%November 1, 2018
99 Sunrise Avenue22,0901.124$3,850,000 $174 n/aApril 19, 2018
30 High Meadow Place22,8003.25$7,775,000 $341 5.30%March 19, 2018
1001 Petrolia Road23,0001.472$5,400,000 $235 n/aSeptember 20, 2018
445 Eddystone Avenue23,8501.072$3,750,000 $157 n/aNovember 1, 2018
4455 Chesswood Drive25,7500.125$4,350,000 $169 n/aJuly 16, 2018
129 - 151 Turbine Drive26,2401.53$2,850,000 $109 5.10%February 9, 2018
25 Sheffield Street28,9011.839$3,750,000 $130 n/aFebruary 15, 2018
499 - 501 Garyray Drive31,0001.682$4,450,000 $144 n/aJanuary 12, 2018
64 Eddystone Avenue37,6862.088$4,732,000 $126 5.30%July 3, 2018
126 Tycos Drive42,7921.96$10,000,000 $234 n/aNovember 28, 2018
150 Milvan Drive47,2502.125$6,000,000 $127 n/aMay 9, 2018
In 2018, a total of 15 properties between 20,000 - 50,000 SF were sold. The prices achieved were in the rage of $109 - $341 PSF, with an average building size of 27,737 SF and an average price of $175 PSF.
555 Oakdale Road, Toronto
Toronto Central (Toronto, North York, York, East York) Markets
Properties Sold in 2018, Size Range 50,000 - 100,000 SF
AddressBuilding Size
(SF)Lot Size
(Acres)PricePrice PSFCap RateDate
125 Tycos Drive51,4003.053$13,621,000 $265 n/aJuly 10, 2018
133 Bridgeland Avenue52,0002.981$9,100,000 $175 n/aJuly 6, 2018
430 Flint Road55,7002.371$6,750,000 $121 n/aFebruary 28, 2018
555 Oakdale Road60,7473.007$6,575,000 $108 4.60%May 1, 2018
20 Overlea Boulevard66,3373.1$10,800,000 $163 n/aFebruary 8, 2018
50 Dufflaw Road67,5002.578$7,375,000 $109 n/aJune 28, 2018
Further, in 2018, a total of 6 properties between 50,000 - 100,000 SF were sold. Prices achieved were from $108 - $265 PSF, with an average building size of 58,947 SF and an average price of $157 PSF.
150 Milvan Drive, Toronto
Toronto Central (Toronto, North York, York, East York) Markets
Properties Sold in 2018, Size Range 100,000 SF plus
AddressBuilding Size
(SF)Lot Size
(Acres)PricePrice PSFCap RateDate
835 York Mills Road113,3503.54$8,000,000 $71 n/aMay 22, 2018
600 Clayson Road136,0776.005$10,600,000 $78 n/aMarch 12, 2018
724 Caledonia Road136,5007.19$7,000,000 $51 n/aJanuary 15, 2018
When looking at properties larger than 100,000 SF, a total of 3 sold in 2018. Prices achieved were from $51 - $78 PSF, with an average building size of 128,642 SF and an average price of $66.67 PSF.
724 Caledonia Road, Toronto
Toronto Central (Toronto, North York, York, East York) Markets
Properties Leased in 2018, Size Range 20,000 - 50,000 SF
AddressBuilding Size (SF)CeilingNet RentDate Leased
36 Milvan Dr22,76614$6.00 October 31, 2018
35 Oak Street 24,19213' 8"$3.95*September 25, 2018
103 Brisbane Rd24,20914$4.50 November 16, 2018
5 Sheffield Street 26,25118$5.95*May 10, 2018
5777 Steeles Avenue West28,92018$5.75*May 10, 2018
220-260 Lesmill Road33,33315' 8" $5.25March 23, 2018
585 Canarctic Dr36,85616$6.50 August 20, 2018
98 Norfinch Dr38,16625$6.75 April 5, 2018
601 Gordon Baker Rd38,40018$6.10 November 27, 2018
100 Toryork Dr43,00014$5.50 November 1, 2018
124 Bermondsey Rd43,15021$8.15 June 25, 2018
233 Signet Drive49,86120$6.25*July 13, 2018
350-358 Flint Road 50,00022' 6"$5.50 September 28, 2018
Asking Net Rental Rates*
On the leasing side, a total of 13 properties between 20,000 - 50,000 SF were leased in 2018. The net rental rates achieved were from $3.95 - $8.15 PSF, with an average building size of 35,315 SF and an average net rental rate of $5.10 PSF.
585 Canarctic Drive, Toronto
Toronto Central (Toronto, North York, York, East York) Markets
Properties Leased in 2018, Size Range 50,000 - 100,000 SF
AddressBuilding Size (SF)CeilingNet RentDate Leased
350-358 Flint Road 50,00022' 6"$5.50 September 28, 2018
401 Clayson Rd51,38720$5.95*October 23, 2018
188 Cartwright Avenue60,00016TBCMay 9, 2018
140 Wendell Avenue 70,00015-20$5.50 February 14, 2018
2 Hallcrown Place70,00024$5.95*February 1, 2018
Asking Net Rental Rates*
A total of 5 properties between 50,000 - 100,000 SF were leased in 2018. The net rental rates achieved ranged from $5.50 - $5.95 PSF, with an average size of a building being 60,277 SF and an average net rental rate of $5.58 PSF.
188 Cartwright Avenue, Toronto
Toronto Central (Toronto, North York, York, East York) Markets
Properties Leased in 2018, Size Range 100,000 SF plus
AddressBuilding Size (SF)CeilingNet RentDate Leased
2239 Sheppard Ave W101,15132$7.25 August 31, 2018
2243 Sheppard Avenue West183,77732$6.85*August 16, 2018
2233 Sheppard Ave W290,67636$7.25 August 31, 2018
2233 Sheppard Ave W544,57236$6.95 March 2, 2018
Asking Net Rental Rates*
Lastly, a total of 4 properties larger than 100,000 SF were leased in 2018. The net rental rates achieved ranged from $6.85 - $7.25 PSF, with an average building size 280,044 SF and an average net rental rate of $7.08 PSF.
2233 Sheppard Avenue West, Toronto
Goran Brelih, SIOR
Senior Vice President, Broker
Cushman & Wakefield ULC, Brokerage.
www.cushmanwakefield.com
President, SIOR - Central Canada Chapter
www.siorccc.org
Davidackerman
Active Member
more on the value of industrial property by Key insight leader Goran at Cushman
This week we are covering our fourth sub-market profile.
Toronto East (Pickering) Markets
Properties Sold in 2018, Size Range 20,000 SF Plus

In 2018, 2 properties were sold in the size range of 20,000 - 50,000 SF, with an average building size of 37,145 SF, and the price achieved was $116.50 PSF.
0 properties were sold in the size range of 50,000 - 100,000 SF.
2 properties were sold in the size range of 100,000+ SF, with an average building size of 141,294 SF at an average price of $93 PSF.

1840 Clements Road, Pickering
Toronto East (Ajax) Markets
Properties Sold in 2018, Size Range 20,000 SF Plus

In 2018, a total of 3 properties between 20,000 - 50,000 SF were sold. The prices achieved were in the rage of $105 - $186 PSF, with an average building size of 35,413 SF and an average price of $131 PSF.
There were 0 properties sold in the size range of 50,000 SF - 100,000 SF.
When looking at properties larger than 100,000 SF, 1 property was sold with a building size of 116,779 SF for $91 PSF.

80 Fuller Road, Ajax
Toronto East (Whitby) Markets
Properties Sold in 2018, Size Range 20,000 SF Plus

In 2018, 0 properties were sold in the size range of 20,000 - 50,000 SF, nor in the range of 50,000 - 100,000 SF.
4 properties were sold in the size range of 100,000+ SF. The achieved sold price ranged from $75 - $103 with an average building size of 248,964 SF at an average price of $86 PSF.

1601 Tricont Avenue, Whitby
Toronto East (Oshawa) Markets
Properties Sold in 2018, Size Range 20,000 SF Plus

In 2018, 1 property was sold in the size range of 20,000 - 50,000 SF with a building size of 26,000 SF, and the price achieved was $112 PSF.
1 property was sold in the size range of 50,000 - 100,000 SF with a building size of 58,817 SF, and the price achieved was $103 PSF.
Finally, 2 properties were sold in the size range of 100,000+ SF, with an average building size of 369,500 Sf at an average price of $81 PSF.

1001 Thornton Road South, Oshawa
Toronto East (Pickering) Markets
Properties Leased in 2018, Size Range 20,000 SF Plus

Asking Net Rental Rates*
A total of 4 properties between 20,000 - 50,000 SF were leased in 2018. The net rental rates achieved ranged from $5.15 - $7.25 PSF, with an average size of a building being 36,192 SF and an average net rental rate of $6.03 PSF.
Lastly, no properties were leased in the size range of 50,000 - 100,000 SF, nor in the range of 100,000+ SF.

1420 Bayly Street, Pickering
Toronto East (Ajax) Markets
Properties Leased in 2018, Size Range 20,000 SF Plus

Asking Net Rental Rates*
A total of 3 properties between 20,000 - 50,000 SF were leased in 2018. The net rental rates achieved ranged from $4.88 - $5.50 PSF, with an average size of a building being 25,654 SF and an average net rental rate of $5.29 PSF.
No properties were leased in the size range of 50,000 - 100,000 SF, nor in the range of 100,000+ SF.

89 Mills Road, Ajax
Toronto East (Whitby) Markets
Properties Leased in 2018, Size Range 20,000 SF Plus

Asking Net Rental Rates*
A total of 4 properties between 20,000 - 50,000 SF were leased in 2018. The net rental rates achieved ranged from $4.80- $7.35 PSF, with an average size of a building being 28,747 SF and an average net rental rate of $6.15 PSF.
Further, 2 properties were leased in the size range of 50,000 - 100,000 SF. The net rental rates achieved ranged from $5.95 - $6.50 PSF, with an average size of a building being 72,100 SF and an average net rental rate of $6.23 PSF.
Lastly, 1 property was leased in the size range of 100,000+ SF.

185 William Smith Drive, Whitby
Goran Brelih and his team have been servicing Investors and Occupiers of Industrial properties in Toronto Central and Toronto North markets for the past 25 years.
Goran Brelih is a Senior Vice President for Cushman & Wakefield ULC in the Greater Toronto Area.
Over the past 27 years, he has been involved in the lease or sale of approximately 25.7 million square feet of industrial space, valued in excess of $1.6 billion dollars while averaging between 40 and 50 transactions per year and achieving the highest level of sales, from the President’s Round Table to Top Ten Industrial Representatives in GTA and the National Top Ten.
Goran is currently serving as President of the SIOR ‐ Society of Industrial and Office Realtors, Central Canadian Chapter and on the Board of Directors of Muki Baum Accessibility Centre, a Toronto‐based NGO which provides support to children and adults with complex disabilities.
Specialties:
Industrial Real Estate Sales and Leasing, Investment Sales, Design Build and Land Development
For more information on GTA Industrial Real Estate Market or to discuss how they can assist you with your real estate needs please contact Goran at 416-756-5456, email at goran.brelih@cushwake.com, or visit www.goranbrelih.com.
This week we are covering our fourth sub-market profile.
Toronto East (Pickering) Markets
Properties Sold in 2018, Size Range 20,000 SF Plus
In 2018, 2 properties were sold in the size range of 20,000 - 50,000 SF, with an average building size of 37,145 SF, and the price achieved was $116.50 PSF.
0 properties were sold in the size range of 50,000 - 100,000 SF.
2 properties were sold in the size range of 100,000+ SF, with an average building size of 141,294 SF at an average price of $93 PSF.
1840 Clements Road, Pickering
Toronto East (Ajax) Markets
Properties Sold in 2018, Size Range 20,000 SF Plus
In 2018, a total of 3 properties between 20,000 - 50,000 SF were sold. The prices achieved were in the rage of $105 - $186 PSF, with an average building size of 35,413 SF and an average price of $131 PSF.
There were 0 properties sold in the size range of 50,000 SF - 100,000 SF.
When looking at properties larger than 100,000 SF, 1 property was sold with a building size of 116,779 SF for $91 PSF.
80 Fuller Road, Ajax
Toronto East (Whitby) Markets
Properties Sold in 2018, Size Range 20,000 SF Plus
In 2018, 0 properties were sold in the size range of 20,000 - 50,000 SF, nor in the range of 50,000 - 100,000 SF.
4 properties were sold in the size range of 100,000+ SF. The achieved sold price ranged from $75 - $103 with an average building size of 248,964 SF at an average price of $86 PSF.
1601 Tricont Avenue, Whitby
Toronto East (Oshawa) Markets
Properties Sold in 2018, Size Range 20,000 SF Plus
In 2018, 1 property was sold in the size range of 20,000 - 50,000 SF with a building size of 26,000 SF, and the price achieved was $112 PSF.
1 property was sold in the size range of 50,000 - 100,000 SF with a building size of 58,817 SF, and the price achieved was $103 PSF.
Finally, 2 properties were sold in the size range of 100,000+ SF, with an average building size of 369,500 Sf at an average price of $81 PSF.
1001 Thornton Road South, Oshawa
Toronto East (Pickering) Markets
Properties Leased in 2018, Size Range 20,000 SF Plus
Asking Net Rental Rates*
A total of 4 properties between 20,000 - 50,000 SF were leased in 2018. The net rental rates achieved ranged from $5.15 - $7.25 PSF, with an average size of a building being 36,192 SF and an average net rental rate of $6.03 PSF.
Lastly, no properties were leased in the size range of 50,000 - 100,000 SF, nor in the range of 100,000+ SF.
1420 Bayly Street, Pickering
Toronto East (Ajax) Markets
Properties Leased in 2018, Size Range 20,000 SF Plus
Asking Net Rental Rates*
A total of 3 properties between 20,000 - 50,000 SF were leased in 2018. The net rental rates achieved ranged from $4.88 - $5.50 PSF, with an average size of a building being 25,654 SF and an average net rental rate of $5.29 PSF.
No properties were leased in the size range of 50,000 - 100,000 SF, nor in the range of 100,000+ SF.
89 Mills Road, Ajax
Toronto East (Whitby) Markets
Properties Leased in 2018, Size Range 20,000 SF Plus
Asking Net Rental Rates*
A total of 4 properties between 20,000 - 50,000 SF were leased in 2018. The net rental rates achieved ranged from $4.80- $7.35 PSF, with an average size of a building being 28,747 SF and an average net rental rate of $6.15 PSF.
Further, 2 properties were leased in the size range of 50,000 - 100,000 SF. The net rental rates achieved ranged from $5.95 - $6.50 PSF, with an average size of a building being 72,100 SF and an average net rental rate of $6.23 PSF.
Lastly, 1 property was leased in the size range of 100,000+ SF.
185 William Smith Drive, Whitby
Goran Brelih and his team have been servicing Investors and Occupiers of Industrial properties in Toronto Central and Toronto North markets for the past 25 years.
Goran Brelih is a Senior Vice President for Cushman & Wakefield ULC in the Greater Toronto Area.
Over the past 27 years, he has been involved in the lease or sale of approximately 25.7 million square feet of industrial space, valued in excess of $1.6 billion dollars while averaging between 40 and 50 transactions per year and achieving the highest level of sales, from the President’s Round Table to Top Ten Industrial Representatives in GTA and the National Top Ten.
Goran is currently serving as President of the SIOR ‐ Society of Industrial and Office Realtors, Central Canadian Chapter and on the Board of Directors of Muki Baum Accessibility Centre, a Toronto‐based NGO which provides support to children and adults with complex disabilities.
Specialties:
Industrial Real Estate Sales and Leasing, Investment Sales, Design Build and Land Development
For more information on GTA Industrial Real Estate Market or to discuss how they can assist you with your real estate needs please contact Goran at 416-756-5456, email at goran.brelih@cushwake.com, or visit www.goranbrelih.com.
Davidackerman
Active Member
A look at industrial building costs in GTA . according to Goran Brelith
This week we are covering the Toronto-Central Markets (North York, Scarborough, and Etobicoke).
Toronto Central Market (North York)
Properties Sold between January 2019 - March 2019, Size Range 20,000 SF plus

In 2019, a total of 9 properties were sold. The prices achieved were in the range of $88 - $226 PSF, with an average building size of 72,471 SF and an average price of $120.89 PSF.

9-11 Fenmar Drive, North York
Toronto Central Market (North York)
Properties Leased between January 2019 - March 2019, Size Range 20,000 SF plus

Asking Net Rental Rates*
On the leasing side, a total of 5 properties were leased. The net rental rates achieved were from $5.00 - $13.50 PSF, with an average building size of 54,837 SF and an average net rental rate of $7.94 PSF.

3655 Weston Road, North York
Toronto Central Market (Scarborough)
Properties Sold between January 2019 - March 2019, Size Range 20,000 SF plus

A total of 6 properties were sold. The prices achieved were in the range of $83 - $199 PSF, with an average building size of 72,436 SF and an average price of $133 PSF.

60 Minuk Acres, Scarborough
Toronto Central Market (Scarborough)
Properties Leased between January 2019 - March 2019, Size Range 20,000 SF plus

Asking Net Rental Rates*
On the leasing side, a total of 8 properties were leased. The net rental rates achieved were from $4.39 - $7.50 PSF, with an average building size of 27,347 SF and an average net rental rate of $6.53 PSF.

25 Grand Marshall Drive, Scarborough
Toronto Central Market (Etobicoke)
Properties Sold between January 2019 - March 2019, Size Range 20,000 SF plus

A total of 3 properties were sold. The prices achieved were in the range of $92 - $187 PSF, with an average building size of 56,044 SF and an average price of $133.33 PSF.

190 Norseman Street, Etobicoke
Toronto Central Market (Etobicoke)
Properties Leased between January 2019 - March 2019, Size Range 20,000 SF plus

for more info:
goran.brelih@cushwake.com,
This week we are covering the Toronto-Central Markets (North York, Scarborough, and Etobicoke).
Toronto Central Market (North York)
Properties Sold between January 2019 - March 2019, Size Range 20,000 SF plus
In 2019, a total of 9 properties were sold. The prices achieved were in the range of $88 - $226 PSF, with an average building size of 72,471 SF and an average price of $120.89 PSF.
9-11 Fenmar Drive, North York
Toronto Central Market (North York)
Properties Leased between January 2019 - March 2019, Size Range 20,000 SF plus
Asking Net Rental Rates*
On the leasing side, a total of 5 properties were leased. The net rental rates achieved were from $5.00 - $13.50 PSF, with an average building size of 54,837 SF and an average net rental rate of $7.94 PSF.
3655 Weston Road, North York
Toronto Central Market (Scarborough)
Properties Sold between January 2019 - March 2019, Size Range 20,000 SF plus
A total of 6 properties were sold. The prices achieved were in the range of $83 - $199 PSF, with an average building size of 72,436 SF and an average price of $133 PSF.
60 Minuk Acres, Scarborough
Toronto Central Market (Scarborough)
Properties Leased between January 2019 - March 2019, Size Range 20,000 SF plus
Asking Net Rental Rates*
On the leasing side, a total of 8 properties were leased. The net rental rates achieved were from $4.39 - $7.50 PSF, with an average building size of 27,347 SF and an average net rental rate of $6.53 PSF.
25 Grand Marshall Drive, Scarborough
Toronto Central Market (Etobicoke)
Properties Sold between January 2019 - March 2019, Size Range 20,000 SF plus
A total of 3 properties were sold. The prices achieved were in the range of $92 - $187 PSF, with an average building size of 56,044 SF and an average price of $133.33 PSF.
190 Norseman Street, Etobicoke
Toronto Central Market (Etobicoke)
Properties Leased between January 2019 - March 2019, Size Range 20,000 SF plus
for more info:
goran.brelih@cushwake.com,
Davidackerman
Active Member
Cost per sq ft industrial - a deep dive Northern GTA courtesy of Goran at Cushman
This week we are covering the Toronto-North Markets (Vaughan, Markham, Richmond Hill, Newmarket & Aurora)
Toronto North Market (Vaughan)
Properties Sold between January 2019 - March 2019, Size Range 20,000 SF plus

In 2019, a total of 6 properties were sold. The prices achieved were in the range of $118 - $237 PSF, with an average building size of 70,993 SF and an average price of $192 PSF.

777 Creditstone Road, Vaughan
Toronto North Market (Vaughan)
Properties Leased between January 2019 - March 2019, Size Range 20,000 SF plus

Asking Net Rental Rates*
On the leasing side, a total of 13 properties were leased. The net rental rates achieved were from $5.60 - $8.66 PSF, with an average building size of 96,389 SF and an average net rental rate of $7.58 PSF.

7171 Highway 50, Vaughan
Toronto North Market (Markham, Richmond Hill, Newmarket & Aurora)
Properties Sold between January 2019 - March 2019, Size Range 20,000 SF plus

A total of 1 property was sold in Markham. The prices achieved is $172 PSF, with a building size of 110,244 SF and a price of $18,965,000.
A total of 1 property was sold in Richmond Hill. The prices achieved is $180 PSF, with a building size of 44,740 SF and a price of $8,050,000.
1 property was sold in Newmarket. The price achieved is $5,500,000, with a building size of 23,630 SF and a price of $233 PSF.
In Aurora, there were 0 properties sold this quarter.

375 Edward Avenue, Richmond Hill
Toronto North Market (Markham, Richmond Hill, Newmarket & Aurora)
Properties Leased between January 2019 - March 2019, Size Range 20,000 SF plus

Asking Net Rental Rates*
On the leasing side, a total of 1 property was leased in Richmond Hill. The net rental rate was $6.00 PSF, with a building size of 27,241 SF.
There were 0 property leased for this quarter in Newmarket.
In Aurora, 1 property was leased. The net rental rate was $7.99 PSF, with a building size of 53,000 SF.
A total of 3 properties were leased in Markham. The net rental rates achieved were from $6.95 - $8.95 PSF, with an average building size of 77,554 SF and an average net rental rate of $8.13 PSF
For more info goran.brelih@cushwake.com,
This week we are covering the Toronto-North Markets (Vaughan, Markham, Richmond Hill, Newmarket & Aurora)
Toronto North Market (Vaughan)
Properties Sold between January 2019 - March 2019, Size Range 20,000 SF plus
In 2019, a total of 6 properties were sold. The prices achieved were in the range of $118 - $237 PSF, with an average building size of 70,993 SF and an average price of $192 PSF.
777 Creditstone Road, Vaughan
Toronto North Market (Vaughan)
Properties Leased between January 2019 - March 2019, Size Range 20,000 SF plus
Asking Net Rental Rates*
On the leasing side, a total of 13 properties were leased. The net rental rates achieved were from $5.60 - $8.66 PSF, with an average building size of 96,389 SF and an average net rental rate of $7.58 PSF.
7171 Highway 50, Vaughan
Toronto North Market (Markham, Richmond Hill, Newmarket & Aurora)
Properties Sold between January 2019 - March 2019, Size Range 20,000 SF plus
A total of 1 property was sold in Markham. The prices achieved is $172 PSF, with a building size of 110,244 SF and a price of $18,965,000.
A total of 1 property was sold in Richmond Hill. The prices achieved is $180 PSF, with a building size of 44,740 SF and a price of $8,050,000.
1 property was sold in Newmarket. The price achieved is $5,500,000, with a building size of 23,630 SF and a price of $233 PSF.
In Aurora, there were 0 properties sold this quarter.
375 Edward Avenue, Richmond Hill
Toronto North Market (Markham, Richmond Hill, Newmarket & Aurora)
Properties Leased between January 2019 - March 2019, Size Range 20,000 SF plus
Asking Net Rental Rates*
On the leasing side, a total of 1 property was leased in Richmond Hill. The net rental rate was $6.00 PSF, with a building size of 27,241 SF.
There were 0 property leased for this quarter in Newmarket.
In Aurora, 1 property was leased. The net rental rate was $7.99 PSF, with a building size of 53,000 SF.
A total of 3 properties were leased in Markham. The net rental rates achieved were from $6.95 - $8.95 PSF, with an average building size of 77,554 SF and an average net rental rate of $8.13 PSF
For more info goran.brelih@cushwake.com,
Davidackerman
Active Member
Hotel for Sale on Wnyford Drive-
Allied Hotel Properties Inc. (“Allied”) (TSX-V: AHP) is pleased to announce that it has entered into an exclusive sale listing agreement (the “Listing Agreement”) with CBRE Limited (“CBRE”), pursuant to which CBRE has agreed to provide commercial real estate brokerage services to Allied for the potential sale of Allied’s Toronto Don Valley Hotel and Suites, located at 175 Wynford Drive, Toronto, Ontario, and the adjacent development lands (the “Property”).
Allied has not set a definitive schedule to complete the identification of potential buyers or to sell the Property.
Given the nature of the process, Allied does not intend to provide updates until such time as Allied’s board of directors approves a definitive agreement for the sale of the Property, or otherwise determines that future disclosure is advisable. Allied cautions that there is no guarantee that the call for offers to purchase will result in a transaction or, if a transaction is undertaken, as to its terms or timing. Any such transaction would be subject to certain conditions, including receipt of approval from the TSX Venture Exchange (“TSX-V”) and Allied’s shareholders.
While considering offers to purchase, Allied will continue operating its business in the ordinary course.
All parties interested in making an offer to purchase the Property should contact:
About Allied Hotel Properties Inc.
Allied is involved in the ownership, management and development of hotels and real estate in Canada, having a history of real estate development particularly where such development can be undertaken on hotel lands. Allied’s principal assets currently comprise the Toronto Don Valley Hotel and Suites, a 353-room full service hotel located in Toronto, Ontario. Interested parties can find further information at www.alliedhotels.com.
On behalf of the Board of Directors:
(signed) Michael F. Chan
Michael F. Chan
President, Chief Financial Officer, Secretary and Director
For more information please contact:
Allied Hotel Properties Inc.
Tel: 604-669-5335
Fax: 604-682-8131
e-mail: mikechan@alliedhotels.com
Allied Hotel Properties Inc. (“Allied”) (TSX-V: AHP) is pleased to announce that it has entered into an exclusive sale listing agreement (the “Listing Agreement”) with CBRE Limited (“CBRE”), pursuant to which CBRE has agreed to provide commercial real estate brokerage services to Allied for the potential sale of Allied’s Toronto Don Valley Hotel and Suites, located at 175 Wynford Drive, Toronto, Ontario, and the adjacent development lands (the “Property”).
Allied has not set a definitive schedule to complete the identification of potential buyers or to sell the Property.
Given the nature of the process, Allied does not intend to provide updates until such time as Allied’s board of directors approves a definitive agreement for the sale of the Property, or otherwise determines that future disclosure is advisable. Allied cautions that there is no guarantee that the call for offers to purchase will result in a transaction or, if a transaction is undertaken, as to its terms or timing. Any such transaction would be subject to certain conditions, including receipt of approval from the TSX Venture Exchange (“TSX-V”) and Allied’s shareholders.
While considering offers to purchase, Allied will continue operating its business in the ordinary course.
All parties interested in making an offer to purchase the Property should contact:
Allied is involved in the ownership, management and development of hotels and real estate in Canada, having a history of real estate development particularly where such development can be undertaken on hotel lands. Allied’s principal assets currently comprise the Toronto Don Valley Hotel and Suites, a 353-room full service hotel located in Toronto, Ontario. Interested parties can find further information at www.alliedhotels.com.
On behalf of the Board of Directors:
(signed) Michael F. Chan
Michael F. Chan
President, Chief Financial Officer, Secretary and Director
For more information please contact:
Allied Hotel Properties Inc.
Tel: 604-669-5335
Fax: 604-682-8131
e-mail: mikechan@alliedhotels.com
Davidackerman
Active Member
Toronto's Office outpaces US- colliers
Canada’s office construction outpacing U.S.’s by nearly double: Colliers
Rate of building relative to size of office market is 87 per cent higher in Canada than U.S. – but why?
By Joannah Connolly, Glacier Media Real Estate | July 23, 2019, 9:34am

Shutterstock
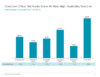
Across North America, an office development boom is underway, with 146,500,000 square feet of space under construction right now, according to a recent report by Colliers International.
Of this under-construction office space, nearly 20.8 million square feet are being built in Canada – which might seem like a fairly modest proportion of North America as a whole. However, relative to the size of the office markets and population in each country, Colliers said that Canada’s pace of office construction is 87 per cent higher than that of the U.S.
Why so much more activity in Canadian office development than in the U.S.?
The Colliers report said, “Reasons for Canada having a higher proportion of the overall construction compared to its overall population include:
The ultra-low vacancy rates and corresponding need for new office supply are key to the high levels of construction. Vancouver and Toronto were recently named the two office markets with the lowest vacancy rates in all of North America, both at just 2.6 per cent, with San Francisco coming in third.
Colliers is not concerned that the wave of new supply of Canadian office space will become a glut that remains unabsorbed. The commercial brokerage added in its report, “Canada has a higher office density per census population than the United States. This combined with a lower average [office] vacancy rate (9.2 per cent compared to 11.6 per cent) show that Canada has a well urbanized population of knowledge workers and will more easily absorb the new office buildings under construction. Without the capacity to allow employers to grow and new companies to enter the market, the potential for growth in Canada would be muted; the new wave of office construction is further cementing Canada as a desirable location for new office employment growth.”
The report comes as major U.S. companies such as Apple and WeWork reveal plans to take up space in under-construction office buildings in Vancouver and Calgary. They are following the footsteps of companies such as Microsoft and Amazon, which will set up its new Vancouver headquarters in the redevelopment Canada Post building.
Canada’s office construction outpacing U.S.’s by nearly double: Colliers
Rate of building relative to size of office market is 87 per cent higher in Canada than U.S. – but why?
By Joannah Connolly, Glacier Media Real Estate | July 23, 2019, 9:34am
Shutterstock
Across North America, an office development boom is underway, with 146,500,000 square feet of space under construction right now, according to a recent report by Colliers International.
Of this under-construction office space, nearly 20.8 million square feet are being built in Canada – which might seem like a fairly modest proportion of North America as a whole. However, relative to the size of the office markets and population in each country, Colliers said that Canada’s pace of office construction is 87 per cent higher than that of the U.S.
Why so much more activity in Canadian office development than in the U.S.?
The Colliers report said, “Reasons for Canada having a higher proportion of the overall construction compared to its overall population include:
- Canada benefiting from high growth in office based employment industries;
- Canada’s substantially lower office vacancy rate is driving new office construction (only three United States cities have vacancy rates lower than the Canadian average of 9.2 per cent); and
- Canada’s more open immigration policies and societal multiculturalism are enabling employment and population growth.
The ultra-low vacancy rates and corresponding need for new office supply are key to the high levels of construction. Vancouver and Toronto were recently named the two office markets with the lowest vacancy rates in all of North America, both at just 2.6 per cent, with San Francisco coming in third.
Colliers is not concerned that the wave of new supply of Canadian office space will become a glut that remains unabsorbed. The commercial brokerage added in its report, “Canada has a higher office density per census population than the United States. This combined with a lower average [office] vacancy rate (9.2 per cent compared to 11.6 per cent) show that Canada has a well urbanized population of knowledge workers and will more easily absorb the new office buildings under construction. Without the capacity to allow employers to grow and new companies to enter the market, the potential for growth in Canada would be muted; the new wave of office construction is further cementing Canada as a desirable location for new office employment growth.”
The report comes as major U.S. companies such as Apple and WeWork reveal plans to take up space in under-construction office buildings in Vancouver and Calgary. They are following the footsteps of companies such as Microsoft and Amazon, which will set up its new Vancouver headquarters in the redevelopment Canada Post building.
Davidackerman
Active Member
| ||
|


Davidackerman
Active Member
update on commercial leases
Just as we deep-dived into the Top New Developments and Land Sales last week - with our higher-level narrative surrounding the lack of available product forcing high-quality Users and/or Developers to build on spec or pre-lease new development - there needs to be something said for good, old-fashioned Sales and Leasing.
Because despite the fact that very little sits on the market, and few people are logging long hours on MLS, deals (and big deals, for that matter) are getting done.
As a whole, the industrial real estate market in the GTA in 2019 continued to dominate headlines. Rental rates have been on the rise while sustained demand is expected to keep industrial markets tight for the foreseeable future.
Specifically, over 21 million square feet leased across the GTA Industrial markets last year; continuing to push vacancy rates down to 1.3%.
E-commerce, Warehousing and Distribution Companies remain the driving force… and with ever-increasing online retail sales, this trend will only continue.
If we could point to a single culprit behind the demand for large industrial buildings close to high-density populations and transportation routes, it is this: consumer expectations for immediate, instant, teleport-to-your-living-room, same-day delivery… and it is shaping entire industries surrounding supply chains.
With new supply of about 7.4 Million square feet and an absorption of 8.8 Million square feet, it is no surprise that average net rental rates keep increasing, and reached a new high of $8.74 per square foot.
So, without further ado, let’s examine the Top Ten Largest Industrial Lease and Sale Transactions in the Greater Toronto Area in 2019.
2019 GTA TOP 10 LEASE TRANSACTIONS
Looking at the table below, you will notice that only a few buildings are of the “old generation” with ceiling heights of 30’ or less, while the others are newer modern facilities with clear heights up to 40’. And basically, all of them fall into the e-commerce, warehousing and/or distribution categories… with the largest Lease Transaction being Amazon taking another million square foot facility.

1. 6351 Steeles Avenue East, Toronto - Amazon

6351 Steeles Avenue East, Toronto
2. Bramkay Street, Brampton - Polar Pak

2 Bramkay Street, Brampton
GTA TOP 10 SALE TRANSACTIONS IN 2019
Investment sale transactions, including a few portfolio sales, dominated this category… with the largest sale being the sale-leaseback of a brand-new distribution centre in Milton, located at 2200 Yukon Court.
Most of the CAP rates achieved are between 4.5% - 4.75%… but it really depends on the asset, tenant, and the lease structure (including the rental rate).
For example, in a situation where the lease term is near expiry and saddled with an older rate considerably below the current market level… then a Purchaser would be able to renew the lease or re-lease the property at a higher rental rate, effectively making a much lower CAP rate (even sub-4%) a doable proposition, as their yield would adjust upwards.

1. 2200 Yukon Court, Milton - DSV Sale to GWL Realty Advisors

2200 Yukon Court, Milton
2. 2020 Logistics Drive, Mississauga, Panattoni Sale to Granite REIT

2020 Logistics Drive, Mississauga
What Lies Ahead:
Just as we deep-dived into the Top New Developments and Land Sales last week - with our higher-level narrative surrounding the lack of available product forcing high-quality Users and/or Developers to build on spec or pre-lease new development - there needs to be something said for good, old-fashioned Sales and Leasing.
Because despite the fact that very little sits on the market, and few people are logging long hours on MLS, deals (and big deals, for that matter) are getting done.
As a whole, the industrial real estate market in the GTA in 2019 continued to dominate headlines. Rental rates have been on the rise while sustained demand is expected to keep industrial markets tight for the foreseeable future.
Specifically, over 21 million square feet leased across the GTA Industrial markets last year; continuing to push vacancy rates down to 1.3%.
E-commerce, Warehousing and Distribution Companies remain the driving force… and with ever-increasing online retail sales, this trend will only continue.
If we could point to a single culprit behind the demand for large industrial buildings close to high-density populations and transportation routes, it is this: consumer expectations for immediate, instant, teleport-to-your-living-room, same-day delivery… and it is shaping entire industries surrounding supply chains.
With new supply of about 7.4 Million square feet and an absorption of 8.8 Million square feet, it is no surprise that average net rental rates keep increasing, and reached a new high of $8.74 per square foot.
So, without further ado, let’s examine the Top Ten Largest Industrial Lease and Sale Transactions in the Greater Toronto Area in 2019.
2019 GTA TOP 10 LEASE TRANSACTIONS
Looking at the table below, you will notice that only a few buildings are of the “old generation” with ceiling heights of 30’ or less, while the others are newer modern facilities with clear heights up to 40’. And basically, all of them fall into the e-commerce, warehousing and/or distribution categories… with the largest Lease Transaction being Amazon taking another million square foot facility.
1. 6351 Steeles Avenue East, Toronto - Amazon
6351 Steeles Avenue East, Toronto
2. Bramkay Street, Brampton - Polar Pak
2 Bramkay Street, Brampton
GTA TOP 10 SALE TRANSACTIONS IN 2019
Investment sale transactions, including a few portfolio sales, dominated this category… with the largest sale being the sale-leaseback of a brand-new distribution centre in Milton, located at 2200 Yukon Court.
Most of the CAP rates achieved are between 4.5% - 4.75%… but it really depends on the asset, tenant, and the lease structure (including the rental rate).
For example, in a situation where the lease term is near expiry and saddled with an older rate considerably below the current market level… then a Purchaser would be able to renew the lease or re-lease the property at a higher rental rate, effectively making a much lower CAP rate (even sub-4%) a doable proposition, as their yield would adjust upwards.
1. 2200 Yukon Court, Milton - DSV Sale to GWL Realty Advisors
2200 Yukon Court, Milton
2. 2020 Logistics Drive, Mississauga, Panattoni Sale to Granite REIT
2020 Logistics Drive, Mississauga
What Lies Ahead:
- Rental Rates: As stated before, the GTA Industrial Average Net Rental Asking Rates increased by more than 20% year-over-year to $8.74, the highest level we have ever seen. And with so much demand and very little, or almost no, supply in certain markets, this will continue to a new high at the end of Q1 2020… stay tuned….. We see most of the net rental rates on lease renewals doubling and tenants not having any options… specifically in the small- and mid-bay market…
- Property Values: The Average Sale Price in the GTA is about $225 PSF, while small- and mid-bay product is fetching more than $300 PSF…. this trend will continue… CAP Rates seem to be steady between 4.5% to 4.75% for most of the product, and obviously depending on the sub-market, quality of the asset, and the lease agreement and net rental rates in place….. It could swing down to below 4% or go up to 5% and higher…..
Davidackerman
Active Member
update on land valuations from Cushman for industrial market
|


Davidackerman
Active Member
Colliers sells 824 Sheppard ave west for 12, million +

Davidackerman
Active Member
great feature on future of office market in COvid PBS
Davidackerman
Active Member
33 Yorkville for sale-
33 Yorkville Avenue, Toronto has just been offered for sale by CBRE and RBC. Arguably the best residential development land in Canada, site plan approved for ~912,700 sf of residential and retail density. For access to the online data room and Confidential Information Memorandum, please contact Kristal Shea at CBRE.
33 Yorkville Avenue, Toronto has just been offered for sale by CBRE and RBC. Arguably the best residential development land in Canada, site plan approved for ~912,700 sf of residential and retail density. For access to the online data room and Confidential Information Memorandum, please contact Kristal Shea at CBRE.