News   Jan 08, 2025
 512     0 
News   Jan 08, 2025
 1K     1 
News   Jan 08, 2025
 531     1 

Baby, we got a bubble!?

But due to the drop back to 1987 prices, if you talk about overall price changes (ignoring the short anomaly), it should actually range from 1987 to 2012 with 120% increase. Is a doubling of prices over 25 years a bubble?

A good question, hence the purpose for this discussion thread. Those who say yes, point out that such doubling every 25 years is unsustainable, as housing will quickly represent more than 100% of the economy. Those who say no, argue that this is a one time adjustment, and that prices will be flat from now on.

From the chart between 1974 to 1987 (13 yrs) prices increased from $50 to about $180. That's over 200%. How come no cried bubble?

Actually are you calculating from the blue or red line?

The blue line is the Nominal price (ie included effects of substantial levels of inflation)
The red line is the Real price (ie after removing the distorting effect of inflation)

So one should use the red line, and the real price change from 1974 to 1987 was not $50 to $180 but actually $180 to $180 (adjusted to 2002 dollars, as per the graph)
 
So one should use the red line, and the real price change from 1974 to 1987 was not $50 to $180 but actually $180 to $180 (adjusted to 2002 dollars, as per the graph)

So that's basically no growth at all for 13 years. If it's averaged out, prices increased 120% over 38 years. With prices flat and finally making a rise later in the past 25 yrs. Do people expect no growth in prices? If the current conditions are abnormal, than does that make no growth normal? What is considered normal growth? double in 50 yrs? 100 yrs?
 
Do people expect no growth in prices? If the current conditions are abnormal, than does that make no growth normal? What is considered normal growth? double in 50 yrs? 100 yrs?

Intuitively, I would expect prices to increase in proportion to wage growth, and to reflect any fundamental improvements to housing.

Historically, this has been shown to be prices increasing about 1% above the rate of inflation, consistent with wage growth. There is data for some housing markets (Amsterdam, going back 400 years) which supports this.

Think about it in the context of the economy. When they talk about the economy "growing 2% next year", then 1% of that is from having more people, and 1% is people making more money". How can the average value of real estate consistently grow faster than the economy? So if we build 1% more houses each year to house population growth, then the long term growth in the average value of property is constrained by economic growth, net of population growth.
 
Intuitively, I would expect prices to increase in proportion to wage growth, and to reflect any fundamental improvements to housing.

Here's some data on income vs housing price. It doesn't mention the exact year they're pulling the data from though.

http://www.globalpropertyguide.com/North-America/Canada/price-gdp-per-cap
USA 27.89x
Canada 16.20x

http://www.globalpropertyguide.com/Pacific/Australia/price-gdp-per-cap
Australia 13.10x
New Zealand 12.09x

Europe
http://www.globalpropertyguide.com/Europe/price-gdp-per-cap
We're ranked in percent below Estonia.

Caribbean
http://www.globalpropertyguide.com/Caribbean/price-gdp-per-cap

Africa
http://www.globalpropertyguide.com/Africa/price-gdp-per-cap

Asia
http://www.globalpropertyguide.com/Asia/price-gdp-per-cap
Compared to Asia, well we're blown out of the water.

Latin America
http://www.globalpropertyguide.com/Latin-America/price-gdp-per-cap

Middle East
http://www.globalpropertyguide.com/Middle-East/price-gdp-per-cap

Looking at the stats, it doesn't seem so crazy. It's just inline along with the rest of the crazy world. I think one of the issues that Canada is facing is the wide income gap where the rich gets richer and the poor gets poor and middle income will disappear in the future. The gap is just becoming visible here whereas the gap already exists in other countries for ages.
 
Last edited:
Here's some data on income vs housing price. It doesn't mention the exact year they're pulling the data from though.

http://www.globalpropertyguide.com/North-America/Canada/price-gdp-per-cap
USA 27.89x
Canada 16.20x


Looking at the stats, it doesn't seem so crazy. It's just inline along with the rest of the crazy world. I think one of the issues that Canada is facing is the wide income gap where the rich gets richer and the poor gets poor and middle income will disappear in the future. The gap is just becoming visible here whereas the gap already exists in other countries for ages.

Exactly correct. And that is what makes the figures compared to GDP misleading.

The rich income is increasing. The middle class barely budging. So the increased affordability is all virtually at the high end but this grossly distorts the price to GDP. The US already has far more wage disparity and I believe that is the reason it is showing up with a much higher ratio than Canada. I believe in another say 5-10 years if current trends continue, Canada's figures will echo those in the US.
 
Here's some data on income vs housing price. It doesn't mention the exact year they're pulling the data from though.

http://www.globalpropertyguide.com/North-America/Canada/price-gdp-per-cap
USA 27.89x
Canada 16.20x

http://www.globalpropertyguide.com/Pacific/Australia/price-gdp-per-cap
Australia 13.10x
New Zealand 12.09x

Europe
http://www.globalpropertyguide.com/Europe/price-gdp-per-cap
We're ranked in percent below Estonia.

Caribbean
http://www.globalpropertyguide.com/Caribbean/price-gdp-per-cap

Africa
http://www.globalpropertyguide.com/Africa/price-gdp-per-cap

Asia
http://www.globalpropertyguide.com/Asia/price-gdp-per-cap
Compared to Asia, well we're blown out of the water.

Latin America
http://www.globalpropertyguide.com/Latin-America/price-gdp-per-cap

Middle East
http://www.globalpropertyguide.com/Middle-East/price-gdp-per-cap

Looking at the stats, it doesn't seem so crazy. It's just inline along with the rest of the crazy world. I think one of the issues that Canada is facing is the wide income gap where the rich gets richer and the poor gets poor and middle income will disappear in the future. The gap is just becoming visible here whereas the gap already exists in other countries for ages.


AKS, some points on the data you've quoted

1. It is not "income vs housing price" as you state. Rather it is:
"The house price to income ratio is the ratio of the cost of a typical upscale housing unit of 100 square metres, compared to the countrys GDP per capita."

2. The site compares the data from #1 to the IMF GDP figures. So it is an apples to apples comparison. If you go to Asia or Africa, you're comparing the cost of a 100 metre upscale unit to the countries average wage, the ratio will be very high. The site acknowledges this by stating:
"Normally this ratio will be much higher in low income countries than in high income countries."

3. The site is run by an Australian lawyer and his wife, yet purports to provide a level of Worldwide comprehensive RE property analysis based upon:
" the Global Property Guides own proprietary in-house research".

Translation : They will not tell you the source of their data(!)

In summary, if one looks around the internet you can find a data source supporting everything from bigfoot to UFO's. While I appreciate you providing some data sources for the discussion, in order to have a productive discussion on this thread, its probably best if we each try to quote credible data sources (the Economist, IMF, World Bank, Stats Cat, recognized educational institutions, or others who at least provide the source of their data and their methodology.
 
...the 40% decrease does not "actually mean the increase from 1985 to 1989 was more in the range of 66%". I presume you've derived the 66% increase, as the necessary increase such that a subsequent 40% decrease would return the price to starting point (ie 166 x 60%=100). But that is not what you wrote. And further, the price increase from 1985-1989 was 85%, not 66%.
...

I stand corrected, daveto. What I meant to say was that the price increase from 1987-1989 was roughly 66%.

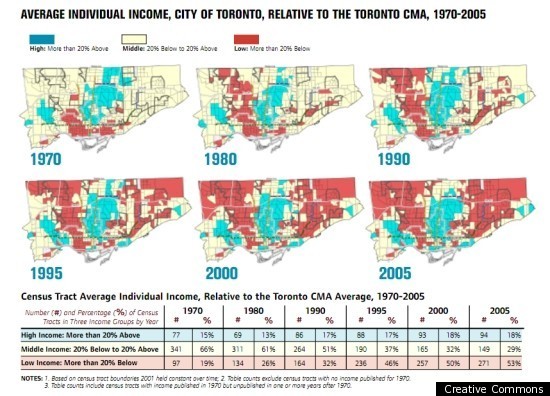
On the topic of income polarization, we've certainly witnessed this trend in the Toronto real estate market as well. With what used to be middle class neighborhoods evolving into lower income neighborhoods in Toronto west & east and gentrifying into higher income neighborhoods concentrated in the central areas.

CANADA-INCOME-GAP-TORONTO-RESIDENTS-PANEL.jpg
 
Think about it in the context of the economy. When they talk about the economy "growing 2% next year", then 1% of that is from having more people, and 1% is people making more money". How can the average value of real estate consistently grow faster than the economy?
.

How? Here are some examples over the past few decades....

- Families no longer buy a new car once every three years...
- Both the husband and wife have full-time jobs now...
- Food, clothing, furniture and electronics have become cheaper...
- Borrowing rates are lower...
- Housing is seen as an investment / savings / security..
- etc

For better or worse, these contribute to increased real-estate values relative to overall economic growth...
 
RT, the key word in my post is "consistently". By that I meant not just as a once in a hundred year societal change, but as something ongoing and sustainable. If your argument is that the price increases of the last 16 years are a one time adjustment, then that is different (although I would suggest, somewhat convenient);)

Taking a look at your five points below, leaving aside some surprising claims (food is cheaper?), I trust you can see that these are not sustainable supports for ongoing price appreciation? What happens next - both the husband and wife have 2 jobs? Borrowing rates go lower still, and remain there indefinately? etc

Again, if your argument is that the last 16 years has been a one time price adjustment, or that it is a temporary adjustment which will reverse when borrowing rates go higher, the I apologize for misunderstanding your post.

How? Here are some examples over the past few decades....

- Families no longer buy a new car once every three years...
- Both the husband and wife have full-time jobs now...
- Food, clothing, furniture and electronics have become cheaper...
- Borrowing rates are lower...
- Housing is seen as an investment / savings / security..
- etc

For better or worse, these contribute to increased real-estate values relative to overall economic growth...
 
Really good points!

RT2020's argument could remain valid if domiciles were obtained for owner-occupancy. But, once investors/speculators get involved, pricing loses all sense of rational thought.

RT, the key word in my post is "consistently". By that I meant not just as a once in a hundred year societal change, but as something ongoing and sustainable. If your argument is that the price increases of the last 16 years are a one time adjustment, then that is different (although I would suggest, somewhat convenient);)

Taking a look at your five points below, leaving aside some surprising claims (food is cheaper?), I trust you can see that these are not sustainable supports for ongoing price appreciation? What happens next - both the husband and wife have 2 jobs? Borrowing rates go lower still, and remain there indefinately? etc

Again, if your argument is that the last 16 years has been a one time price adjustment, or that it is a temporary adjustment which will reverse when borrowing rates go higher, the I apologize for misunderstanding your post.
 
- Both the husband and wife have full-time jobs now...

This is a particularly irritating point which is often frog marched out by some analysts. The problem with the point is that it sounds reasonable enough in theory. But the reality is that houses have appreciated FAR more than household income. And have done so for decades.

- Borrowing rates are lower...

Yes, and consumer debt is at all-time-highs. In fact, Canadian consumer debt levels are higher than American consumer debt levels were at the onset of the financial crisis. If real estate price appreciation is merely the result of increased fiscal room in the household budget, then why is debt-to-income higher? And I know a lot of econometrics out there don't include mortgages in the debt-to-income measure for households for some retarded reason (the mortgage interest is a LIABILITY!), but even if we isolate mortgage debt, those levels are still at all-time highs.

Keynesian economists may quip this merely a sign of our credit-worthiness as an economy. But I'd like to fish-slap anyone who says that.

- Housing is seen as an investment / savings / security..

A very dangerous idea promoted by government and banks.

For better or worse, these contribute to increased real-estate values relative to overall economic growth...

As for what real estate contributes to the economy, the actual truth is that high degrees of home ownership have negative macroeconomic effects on the overall economy. High home ownership is strongly correlated with higher unemployment in comparative analysis due to decreased labour mobility.

And there are other knock-on effects. Some economic thinking links the capital strain caused by everyone investing more in real estate as being destructive to manufacturing competitiveness, etc.

When you look at developed countries which have managed to retain a large manufacturing base like Germany, which only has a 40% home ownership rate, there's a compelling case.

In fact, the inverse relationship between increasing home ownership and a decline in manufacturing output in country after country is quite stark.
 
Here's a good one in The Star today. I say that with a hint of sarcasm.

http://www.thestar.com/business/art...ushion-home-price-decline-cibc-economist-says

Fears of steep home price decline ‘much ado about nothing,’ CIBC says

Published on Thursday August 23, 2012

LuAnn LaSalle
The Canadian Press

A widely anticipated downturn in the housing market may not be as bad as feared because the important 25-34 age group will continue to buy houses — some with help from their well-off parents, says a senior economist at CIBC World Markets.

The analysis takes aim at a theory that population growth won’t be strong enough to sustain demand, putting downward pressure on housing prices that have risen dramatically during a years-long period of relatively low interest rates.

“This demographically driven fear is much ado about nothing,†Benjamin Tal, deputy chief economist at CIBC World Markets, said Thursday.

Tal said the group aged between 25 and 34 — the age group that makes up the vast majority of first-time buyers — will continue to grow.

Young people may have to postpone buying a house for a couple of years due to their student debt level, but their parents can help them out, Tal said from Toronto.

“Many of those young people — they’re lucky — they have wealthy parents,†Tal said in an interview after the report was published.

“This is actually the first generation that the parents are better off than the kids and those parents will write a nice cheque,†he said. “The student debt level is not significant enough to really kill the housing market.â€

This group of young people also have the option of living with their parents while paying down their debt and saving for a down payment, he said.

Tal said once they move out, the younger generation will be “extremely dynamic†in terms of self-employment and being employable, which will help them buy houses.

“They will work and they will make money,†Tal said.

Tal notes there will be fewer Canadians under the age of 25 and between the ages of 45 and 54, but those groups account for a small portion of home buyers.

He expects a “correction†— or lowering — in housing prices will not be seen as “up in the sky†and should follow inflation.

Tal also added that growth in the housing market could be even stronger due to immigration.

Overall, the CIBC economist says the next decade will see an annual population growth of 0.9 per cent, in line with growth seen in the past decade — a period of strong demand for residential real-estate and a sharp jump in housing prices.

“Itâ™s not about everything is rosy, it’s about what is after the storm clouds.â€
 
The world will not end in 2012. RIM stock will hit $6.50 (which is my buy target). New Condo construction sales will slow dramatically and this thread will hit the 400 page mark.

Wow, based on my predictions for 2012 from last December; my batting average is a perfect 1.000 :D
 

Back
Top