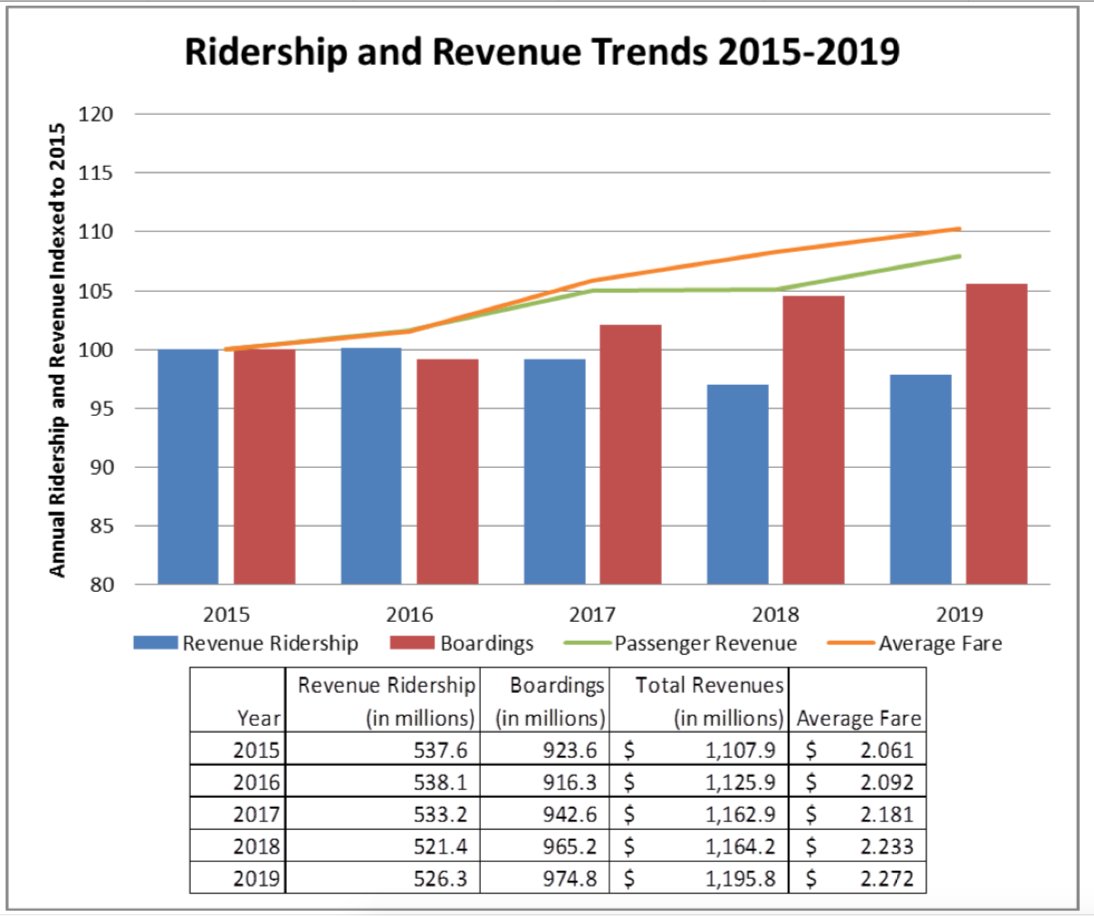
Wow ... no wonder they've been hiding this. West Harbour has 58 riders a day, compared to 1,400 a day at Hamilton GO Train. Don't they both get the same number of trains per day?
I'm not sure what the numbers represent. Arrivals? Departures? Combined?
I'm not sure how they add up either. If you add up the 7 lines, it comes to 23.0 million riders with 2.8 million for UP express (including Union). And then there seems to be 18.4 million for Union Station GO trains. That totals to 41.4 million (44.2 including UP Express). But it also says total Go Train ridership is 38.8 million and total of everything is 52.5 million (GO Trains, GO Buses, and UP Express). That implies GO Buses are 10.9 million. But
back in June they said there were 68.5 million boardings a year. Something isn't adding up.
Interesting to see that Danforth ridership, which many have complained is very unused, is higher than Kitchener, Guelph, Acton, and Georgetown combined!


") (I thought my wife must have had it, so had given up searching the first time) ... but he was professional about it. I'm sure some have had bad experiences ...
(I thought my wife must have had it, so had given up searching the first time) ... but he was professional about it. I'm sure some have had bad experiences ...