News   Apr 25, 2024
 11     0 
News   Apr 25, 2024
 314     0 
News   Apr 24, 2024
 1.2K     1 

Toronto Urban Sprawl Compared to Other Cities

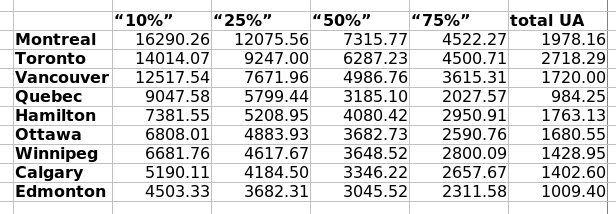
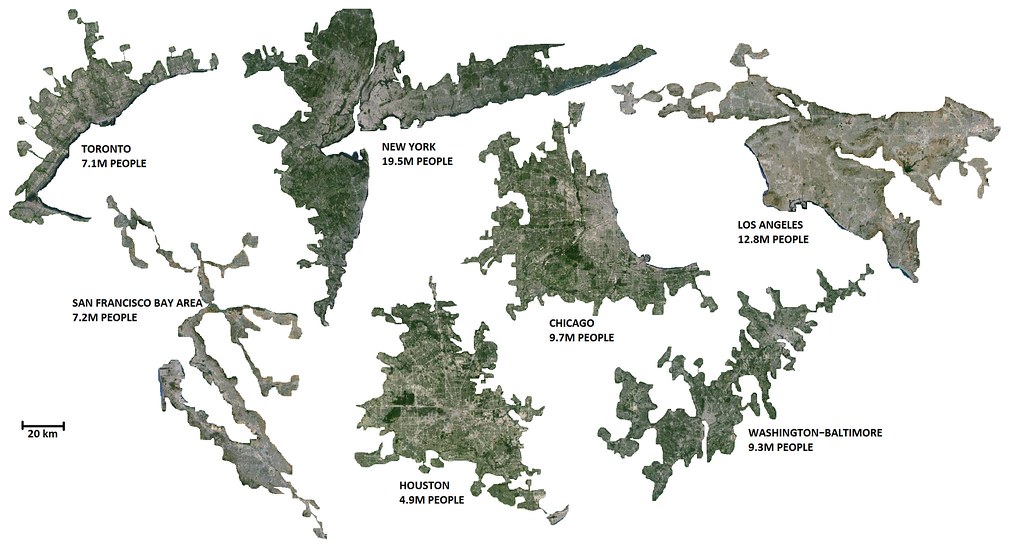
I did renderings for Canada's cities as well. I posted it a page or two before this one. Canada's cities are far more contained. We seem to have a pretty low tolerance for exurbs. SF and LA are limited by their geographical constraints, otherwise they would've sprawled further, and even with those constraints, they're still less dense than Toronto. .

I think you underestimated LA's population. LA county has 10 million alone, and most of that population is visible in your map. You've also included pretty much all of Orange County (3 million) and San Bernardino County (2 million) and quite a bit of Riverside county (2 million).

I think it's safe to say that about 16 million people live in your coloured area for LA. I think LA is actually denser than the GTHA.

Yah I made a mistake with LA. I used MSA instead of CSA population.

I don't think you're right about the densities though. Flar put this together in 2007:
desnity5.jpg

http://forum.skyscraperpage.com/showthread.php?t=138325

Hamilton and Oshawa brings GTHA density down a bit, but not by much due to them only being 1/7 of the population to begin with and already having fairly high densities themselves. But Oakland and SJ would bring down the Bay area's and OC/Riverside/SB would bring down LA's, so Toronto would most likely still come out on top.

LA is about 2700 and SF is about 2400.

http://en.m.wikipedia.org/wiki/List_of_United_States_urban_areas
 
Last edited:
Yah I made a mistake with LA. I used MSA instead of CSA population.

I don't think you're right about the densities though. Flar put this together in 2007:
desnity5.jpg

http://forum.skyscraperpage.com/showthread.php?t=138325

Hamilton and Oshawa brings GTHA density down a bit, but not by much due to them only being 1/7 of the population to begin with and already having fairly high densities themselves. But Oakland and SJ would bring down the Bay area's and OC/Riverside/SB would bring down LA's, so Toronto would most likely still come out on top.

LA is about 2700 and SF is about 2400.

http://en.m.wikipedia.org/wiki/List_of_United_States_urban_areas

Don't get caught in the trap of using different figures from different sources. Density is a very difficult thing to measure accurately and fairly for comparative purposes, because there are many assumptions you need to make about what land is included and what is not. Using the grossest definition - which is the population divided by area of all the census tracts that make up the CMA - will give you a number which includes a lot of rural and natural areas. In order to be a fair comparison you need to deduct these areas. If you try to refine that by using the population divided by the rough boundaries of the urban area you need to figure out how many people live in the rural areas you've excluded and deduct them. However many cities have large green areas within their urban boundaries (e.g. Don Valley) that are not developable. To include them in the density figure distorts the comparison because some cities have more open space and some cities have less open space. Not to exclude it would penalize cities that have protected more of their open space. Therefore to get a real comparison of how densely people are actually living you need to deduct all the open spaces (Do you include large community parks? What about small local parks? What about golf courses?). Then you have to consider that some cities have large industrial, institutional and/or commercial areas that don't house people - so for even more accuracy you want to deduct all the non-residential lands. Now try to find two separate authors who have used the exact same criteria for determining what land should be included and what should be deducted. I bet you will never find two because even if they say they've used the same criteria they've still actually made different assumptions about what should be included and what should be excluded (e.g. are the area of major roads included or excluded, and so on). The ONLY way to accurately compare density in two different cities is to take figures from an author who has calculated the numbers themselves.
 
Don't get caught in the trap of using different figures from different sources. Density is a very difficult thing to measure accurately and fairly for comparative purposes, because there are many assumptions you need to make about what land is included and what is not. Using the grossest definition - which is the population divided by area of all the census tracts that make up the CMA - will give you a number which includes a lot of rural and natural areas. In order to be a fair comparison you need to deduct these areas. If you try to refine that by using the population divided by the rough boundaries of the urban area you need to figure out how many people live in the rural areas you've excluded and deduct them. However many cities have large green areas within their urban boundaries (e.g. Don Valley) that are not developable. To include them in the density figure distorts the comparison because some cities have more open space and some cities have less open space. Not to exclude it would penalize cities that have protected more of their open space. Therefore to get a real comparison of how densely people are actually living you need to deduct all the open spaces (Do you include large community parks? What about small local parks? What about golf courses?). Then you have to consider that some cities have large industrial, institutional and/or commercial areas that don't house people - so for even more accuracy you want to deduct all the non-residential lands. Now try to find two separate authors who have used the exact same criteria for determining what land should be included and what should be deducted. I bet you will never find two because even if they say they've used the same criteria they've still actually made different assumptions about what should be included and what should be excluded (e.g. are the area of major roads included or excluded, and so on). The ONLY way to accurately compare density in two different cities is to take figures from an author who has calculated the numbers themselves.

You bring up an interesting point, one that I hadn't put too much thought in before. It makes sense to me that a natural barrier, such as a river or a gorge shouldn't be included in the density calculations. Anything man-made should though - including parks. If man built it there was always a choice to put something else there of higher density, therefore it should be counted. For that reason roads, warehouses, plants, everything man chose to build at any given location should be included in the total area.

That said, I don't know what criteria was used to calculate the two sets above.
 
Don't get caught in the trap of using different figures from different sources. Density is a very difficult thing to measure accurately and fairly for comparative purposes, because there are many assumptions you need to make about what land is included and what is not. Using the grossest definition - which is the population divided by area of all the census tracts that make up the CMA - will give you a number which includes a lot of rural and natural areas. In order to be a fair comparison you need to deduct these areas.

"Urban area" (now called "Population Centre") does not comprise an entire CMA. It only includes the urban area. The rural areas are already not counted.


It seems you missed a lot of Westchester County (and beyond) north of NYC. Think of what Metro-North Railroad serves for example. It's massive and extremely low-density sprawl so it's not easy to account for so I don't blame you for missing it.
 
Last edited:
"Urban area" (now called "Population Centre") does not comprise an entire CMA. It only includes the urban area. The rural areas are already not counted.


It seems you missed a lot of Westchester County (and beyond) north of NYC. Think of what Metro-North Railroad serves for example. It's massive and extremely low-density sprawl so it's not easy to account for so I don't blame you for missing it.

Doady: I just noticed much of NY's northern suburbs missing myself...You can also add parts of Putnam and southern Dutchess Counties to that northern area served by MNCR...I also feel that all of Long Island that is to the W of NYS Route 112 running from
Patchogue to Port Jefferson should also have been included on the Long Island section...That route is a sort of dividing line between the sprawling suburbs to the W and the semi-rural areas out to the East End...the exception would be Mastic and Shirley on
the south shore that is to the E of Patchogue...

I also noted that HD mentioned Los Angeles - I learned that some of the older areas like Downtown Los Angeles are of very high density and can in ways be compared to eastern North American cities...and let me add that until the early 60s LA was served by
the massive "Pacific Electric" electric passenger rail system...It still boggles my mind that this system was allowed to be shut down and it took the better part of 25 years to finally get rail transit lines built and get the Metrolink commuter rail system established...

LI MIKE
 
Last edited:
This is an interesting thread. On the topic of how to accurately define density, I wonder if there are any measures that would look at infrastructure costs per person as a measure of meaningful density. For example, using the amount of water pipes and treatment plants divided by the number of users across various regions would provide a ranking of how development patterns are translating into real time costs for residents. One advantage of this is to prevent areas of parkland from diluting averages but allowing their spatial placement and how it seperates populated areas to be captured in overall length of pipe. Doing this for additional services might create a more useable tool in measuring how particular development patterns are contributing to maintenance costs for comparison in a more theoretical sense.
 
It seems you missed a lot of Westchester County (and beyond) north of NYC. Think of what Metro-North Railroad serves for example. It's massive and extremely low-density sprawl so it's not easy to account for so I don't blame you for missing it.

Yeah, I tried to get most of it in. It was tricky because I did it in paint, so I had to outline it all at once, and if I made a mistake I'd have to start over. So basically had to zoom in around the peripheries of each city to figure out what's developed and what isn't. And then there was also the matter of (in NY's case) what's part of the MSA and what's Philly or Hartford. All said, there are a couple mistakes on each one. I definitely need to fix the population numbers for all the US cities now that I have them. For TorOshHam 7.1M is what you get adding up the CMA's, but that's not all urban either (although the actual rural % should be significantly less than what it is for Washington and Houston where it makes about a 30% difference).

Overall I think it gives a good general gist of each city. I was more interested to see how the size compares vs the US cities and now I know :p
Paint? You should try GIMP or Paint.NET.
 
Paint? You should try GIMP or Paint.NET.

I like Paint.NET, but forgot about it when I did this. It's on my old computer but not on my laptop. Good old Paint is handy enough though. By no means am I an artist so Paint is all I need 90% of the time.
 
Interesting read. See this link on One Failure of Suburbia

.
In some ways, suburbia has clearly given its residents the benefits they hoped for: newer housing with more space, cheaper housing than in the most fashionable city neighborhoods, and "better" (that is, more racially and economically segregated) schools. In addition, it could be argued that suburbs are safer than most city neighborhoods.

But this is not to say that suburbs have lived up to their promise. I was recently skimming a book on suburbanization** and noticed the following statement by someone who moved from Buffalo to one of its suburbs: "I just want my kids to be safe ... [in the suburbs] But I can send my kids to the store and be confident they won't be approached by anyone." But can you really "send your kids to the store" in suburbia?

Not until they can drive. Even if your children (unlike most suburbanites) live within walking or biking distance of a store, there seems to be a norm in suburbs and small towns against children (or even teenagers) being on their own. In suburban Atlanta, I rarely saw anyone too young to drive outdoors (unless they are in a parking lot on the way to or from their parents' car).

...
 
Found a pretty great NFB film (mockumentary sorta) on the suburbs. I'm not sure if its been posted here yet but the link is below. Its got Ken Greenberg James Howard Kuntsler and other academics following a family. Great cinematography and well put together in that its not boring, its almost fun!

Radiant City: https://www.nfb.ca/film/radiant_city
 
The Top 12 Movies About Urbanism


See link.

Movies play a powerful, if rarely recognized, role in how we understand urbanism, whether they are set in drivable suburban or walkable urban places. So in the run-up to the Academy Awards on March 2, it seems appropriate and mildly educational to present our entirely subjective list of the top 12 movies about urbanism.

We used three criteria to add a veneer of scholarly rigor to our rankings. First, the movies had to be popular, not obscure indie films. Second, the urban/suburban setting was an essential “character†in the film, even if a subtle one. Third, there are lessons to learn from the film about urbanism and its consequences on society, economics and the environment.

1. Back to the Future I & II.
2. Chinatown.
3. Blade Runner.

4. Do the Right Thing.
5. It’s a Wonderful Life.
6. Sunshine State.
7. The Truman Show.
8. The Majestic.
9. Metropolis.
10. You’ve Got Mail.
11. Blue Jasmine
12. Mr. Blandings Builds His Dream House.
 
Yeah Back To The Future did correctly predict the revitalization of downtowns. Only one year until 2015 and still no flying cars or hoverboards though.
 

Back
Top