News   Jul 24, 2024
 338     0 
News   Jul 24, 2024
 311     0 
News   Jul 23, 2024
 838     0 

Baby, we got a bubble!?

Recharts, your main problem here is this is an urban toronto forum, not a suburban toronto forum. We've been discussing the condo market for the past 11 years on this site. SFH don't really interest us :)

Drewp: Nonsense re: "no new rental buildings are built anymore in the donwtown core"
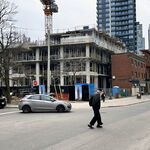
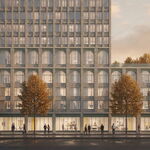
1)Motion rental building at Bay & Dundas
2)TCHC buildings at City Place, Regent Park, King East, etc
3)More on the way

#3 is the dangerous one. Developers can--and imo will--flip from condos to apartment buildings in a heart beat. The condo market is proof that rental demand is there. Developers with a background in rentals--Minto, Concert, Tridel--will start building 1000s of rental units if the condo market can't keep their employees busy. It happened in Seattle, Portland, NYC ...

Yes you are right, I was being a bit dramatic. Of course there are rental buildings being built, but not to the supply that is needed. Close to 30,000 people move into the core every year--the rental market has been performing quite well this year. Although I do notice in C1, prices are flat so far. But considering there was a double digit increase last year I expect to see a flat----to a slight increase during the first half.

First reason, there has been quite a bit of supply to come on the market 8 Charlotte, 28 Ted Rogers Way, 8 Dovercourt, 151 Dan Leckie Way to name a few. Many investors in the past would be selling their condo, but Investors realize where the market is leaning towards.

Second reason, the resale market is showing some signs this year. I have been somewhat surprised by the number of condo listings sell over asking. I have talked to more and more people that rented last year tell me prices have become to high to rent--so they have decided to buy. I am not saying this is the general consensus, but more people are thinking about it, whereas last year it wasn't an option.
 
Second reason, the resale market is showing some signs this year. I have been somewhat surprised by the number of condo listings sell over asking. I have talked to more and more people that rented last year tell me prices have become to high to rent--so they have decided to buy.

C'mon Drew, now you're sounding like an agent just when I was starting to like you.
 
Here is a short look at the condo wet dreams (last 10 days stats)

http://recharts.blogspot.de/2013/05/short-look-at-gta-condo-market.html

Per your data, for April the avg Sale/List % for 416 Condos is 98%?
And for C01, the ratio is 98%?

How is this information any different from what is already contained in the TREB Market Watch pages 13/14, 2nd last column? (here I'm using March, as April is not yet published)
http://www.torontorealestateboard.com/market_news/market_watch/2013/mw1303.pdf

I acknowledge that your data shows the distribution around the average and median, but that seems like a straight forward normal distribution, with a few outliers.
 
Last edited:
Another question.

1497 GTA resale condos sold in the past 10 days of April, 2013? That suggests 4000+ for the month, which seems 50-100% high.

For April, 2012, there was a full month total of 2171. (or 2943 total including condo townhouses).
 
Per your data, for April the avg Sale/List % for 416 Condos is 98%?
And for C01, the ratio is 98%?

How is this information any different from what is already contained in the TREB Market Watch pages 13/14, 2nd last column? (here I'm using March, as April is not yet published)
http://www.torontorealestateboard.com/market_news/market_watch/2013/mw1303.pdf

I acknowledge that your data shows the distribution around the average and median, but that seems like a straight forward normal distribution, with a few outliers.
Show me where I pretended that for condos my information is different.
The whole thing is already taking too much of my time and I don't think that the Condo market can be safely looked at based on a heat map (too many points at the same geographical coordinates) .
I should probably dive into specifics like sqf, location,how old is the condo and many others which will take me a lot of time and as I said I do not have that time. Someone was saying that the condo market is stable. Ignoring the increasing inventory I looked just at the final price reported as percentage from the last asking price and that doesn't look very promising GTA wide or for C01 in particular
I am fully aware that I could also look at DOM which, considering high inventory, will be a clear indicator for a market that is leaning toward a buyer's market (next to a severe correction). More than for SFD I am sure that the condo market will correct big time because here we have all the signs of a bubble (low sales, increasing inventory). The panic will take the control by the end of the summer with "investors" facing the prospects of another year with negative cash flow. Do not even mention renting because as I posted below the rents are going down.

Other than the above, yes, the two sets of data are identical BUT that will never stop me to post them as an alternative to the TREB data if I find the time. Right now I am in need to automate the whole thing otherwise I will end up doing just this :)) posting stats and this is not my day job. I do believe that the 10000 feet reports that TREB provide can be better by looking at local specifics and by looking at particular features for these listings. If they don't want to do it we can do it.
I might ask for help for a volunteer :)
I will provide the data with the condition that the results will be posted on my site (and anywhere else you wish as well)
I am still thinking about this.
 
dude, easy on the attitude. I appreciate the efforts, but authorship doesn't breed objectivity. A little humility and willingness to listen will allow you to direct your efforts more productively.
 
dude, easy on the attitude. I appreciate the efforts, but authorship doesn't breed objectivity. A little humility and willingness to listen will allow you to direct your efforts more productively.

before we analyze my attitude, can we focus on your initial statement which was left in the air like you never said that. Let's finish tat first and let's not change the topic.
Have I pretended that my info was better? And if yes please tell me where.

FYI I am a very reasonable guy as long as you are but I don;t think that above you are, "dude"!
 
so in your opinion is totally acceptable to presume that almost everybody asked for more and they got less
why that doesn't apply to Toronto where my maps show mixed results ??


to attract buyers and start a bidding war


they do not advertise. That is the problem. Some of us have indirect access to their data.
In fact that is the problem here, I am trying to show that the correction is happening but we are not allowed to see it, to have the big picture
It can still be hidden under the average numbers as the ISYM's numbers show us (see his links posted above)


If you have data refering strictly to your street why would you care about average or even median???
That is were my map is very good and nothing else can show you that.
I would be glad to learn about another way to do it.

My point is that you're placing too much value on % of asking price sold. Just to rephrase my example, if a house down the street sold last month (same builder, same finishes) at $500,000, I list at $600,000, and I get $550,000, by your assertion, the market is "cold" since I got 92% of my asking price. This does not account for the fact that just last month, an identical product sold for $500k, thus, the market has appreciated 10% in 1 month - hot by any standard. Conversely, if I list my house at $450,000, and I sold for $490,000, the same map you showed us will say the market is hot. It does not account for the fact that the market has cooled $10,000 (2.5%) in one month. I think all you need to do on this forum is to not make blanket assertions, and let us look at your data points and maps. They are great tools, but if you over hype them or to make conclusions that don't follow, your credibility will be shot.

And yes, I have seen numerous ads where the agent is proud to announce 99%, 98% etc of sold price. I don't have the time to dig them up since they are all thrown out the moment I get them in the mail, but they exist. I put very little weight in these ads since I am aware the list price is easily manipulated. I can try to sell a parking spot for $300k tomorrow if I like. Nobody will stop me from doing so. I bet I can find an agent willing to do the leg work for me too, if he or she thinks I will settle for a reasonable price once negotiations start.

Recharts, let me say at least that I appreciate your charts since they shed light into the situation, but it is only one piece in a very complex situation. Please keep up the good work in compiling the information. I just don't agree with the conclusions you have reached with just the data you presented.
 
before we analyze my attitude, can we focus on your initial statement which was left in the air like you never said that. Let's finish tat first and let's not change the topic.
Have I pretended that my info was better? And if yes please tell me where.

FYI I am a very reasonable guy as long as you are but I don;t think that above you are, "dude"!

????

Why are you asking where you "pretended" your info was "better", and when did that become the topic?

I neither used, nor implied either of those words. It may be that English is not your native language, and if so I empathize with the challenges of learning it. But you may want to re-read my post (from 11:58 today) with the use of a dictionary.
 
Do you actually have some numbers to support this ?

As far as I know at this moment the Toronto Condo market had the highest inventory ever for this March since 2007 and more are being build as we speak

Sorry, my bad. Prices are flat according to most recent reports, but you're right, inventory is slightly up YOY (though not alarmingly so): http://imgur.com/2AWJLgC (I got this graph from http://www.theglobeandmail.com/glob...-condo-graphic/article11224193/?from=11237655).
 
My point is that you're placing too much value on % of asking price sold. Just to rephrase my example, if a house down the street sold last month (same builder, same finishes) at $500,000, I list at $600,000, and I get $550,000, by your assertion, the market is "cold" since I got 92% of my asking price. This does not account for the fact that just last month, an identical product sold for $500k, thus, the market has appreciated 10% in 1 month - hot by any standard. Conversely, if I list my house at $450,000, and I sold for $490,000, the same map you showed us will say the market is hot. It does not account for the fact that the market has cooled $10,000 (2.5%) in one month. I think all you need to do on this forum is to not make blanket assertions, and let us look at your data points and maps. They are great tools, but if you over hype them or to make conclusions that don't follow, your credibility will be shot.

And yes, I have seen numerous ads where the agent is proud to announce 99%, 98% etc of sold price. I don't have the time to dig them up since they are all thrown out the moment I get them in the mail, but they exist. I put very little weight in these ads since I am aware the list price is easily manipulated. I can try to sell a parking spot for $300k tomorrow if I like. Nobody will stop me from doing so. I bet I can find an agent willing to do the leg work for me too, if he or she thinks I will settle for a reasonable price once negotiations start.

Recharts, let me say at least that I appreciate your charts since they shed light into the situation, but it is only one piece in a very complex situation. Please keep up the good work in compiling the information. I just don't agree with the conclusions you have reached with just the data you presented.

I think that you missed exactly the strogest pooint of my maps
On my maps you see a marked for a sale.
That marker has a color which indicates the price range.
The area where the marker is placed also has color which indicates the local (street level) average for that area.
By comparing the two (and also by holding the mouse over the marker and getting the exact sale price) you can properly evaluate the +- percent over the asking price and see if that is a lie or not (i.e a biddig war in the true sense of the word)

Go back and look again

Thanks for your feedback. I know that I am doing a good job and no matter how many comments I receive about that I will continue to do that because it is helping me in the first place. Next, there is around 20% (and counting) returning visitors who believe the info is useful, so if that is so I will continue my work
 
Sorry, my bad. Prices are flat according to most recent reports, but you're right, inventory is slightly up YOY (though not alarmingly so): http://imgur.com/2AWJLgC (I got this graph from http://www.theglobeandmail.com/glob...-condo-graphic/article11224193/?from=11237655).

I recommend you the front page article at www.theeconomicanalyst.com
Ben Rabidoux is pretty objective and his graph for Toronto Condos shows the highest value ever for this segment so ..it is not just slightly up (the inventory)

no comments about prices but check this out http://pastebin.com/raw.php?i=rNjCr7Fd
This was posted on greaterfool.ca by a faithful reader of that blog :)
You can do the maths yourself and see if your statement for prices is OK


Scroll down all the way to the bottom
HTML:
City/Town	Listing Count	Average Sold Price	Average List Price	Average Org. Price	Average SP/LP $	Average SP/LP %	Median Sold Price	Median List Price	Median SP/LP $	Median SP/LP %
Brampton	304	$369,877	$378,274	$379,927	-$8,396	97.80%	$365,000	$374,850	-$7,000	97.80%
Markham	223	$500,602	$507,916	$511,062	-$10,460	98.20%	$439,200	$448,000	-$7,500	98.10%
Mississauga	589	$375,888	$375,994	$377,616	-$1,727	98.90%	$329,000	$333,000	-$6,900	97.80%
Oakville	94	$594,884	$608,046	$611,729	-$16,845	97.50%	$502,750	$514,000	-$7,000	98.10%
Richmond Hill	141	$525,562	$534,270	$537,161	-$11,598	97.70%	$485,000	$489,000	-$9,500	97.80%
Toronto	2329	$447,549	$452,573	$454,851	-$7,302	98.20%	$365,000	$369,900	-$7,000	97.80%

I bet you that if I map that you will see red all over the map on my markers


@daveto; you implied that when you asked "how is your data different from"
If I am not wrong I also asked if I ever posted data about condos in the past. I think you ignored that part of the question too.
As I said I never pretended that my maps or stats deal with condos. I posted some data today as a favor and here you go you jump on me explain you this and that. Till 10 minutes ago when I discovered the above my data was all I knew about TO condo sales and I gave you all I knew.
 
Last edited:
Sorry, my bad. Prices are flat according to most recent reports, but you're right, inventory is slightly up YOY (though not alarmingly so): http://imgur.com/2AWJLgC (I got this graph from http://www.theglobeandmail.com/glob...-condo-graphic/article11224193/?from=11237655).

I recommend you the front page article at www.theeconomicanalyst.com
Ben Rabidoux is pretty objective and his graph for Toronto Condos shows the highest value ever for this segment so ..it is not just slightly up (the inventory)

You are both referring to the same graph.

Kenny said "...inventory is slightly up YOY", which is true (up 10% YOY)
Recharts said "...shows the highest value ever for this segment", which is true.
Recharts also said "...it is not just slightly up", and this is a question of semantics, and how one wishes to define "slightly", and whether you are comparing 2013 to 2012, or to the avg of 2007-12.
 
@daveto; you implied that when you asked "how is your data different from"

No, I didn't. You inferred it, which is your issue, not mine.

If I am not wrong I also asked if I ever posted data about condos in the past. I think you ignored that part of the question too.

It's not relevant. The point is that your data comes from TREB, and the summary you provided showing List/Sale % is largely the same as the summary on TREB. This applies regardless of whether the summary shows condos/townhouses/semi's or detacheds.
 

Back
Top