


MiExpress
New Member
Will there be any addition in the capacity or will all 165 new buses replace 165 old buses?
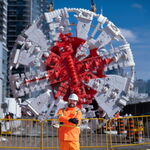
The 165 buses are all replacement buses to replace 2003-2006 40' buses and the 2010 60' buses. There is no reduction because many of the 2003 buses were retired and replaced in 2018 and 2019. Further 16 40' buses will be replaced by 16 60' buses for a increase in capacity.Its reducing capacity at this time due to COVID ridership numbers: 43 0300, 71 0500, 52 0600, 34 0700 = 200 buses + 43 0800 doing the 15 years cycle. The EZ buses for 0700 and 0800 have already been replaced. Then you have the articulated buses that retire after 12 years where an special was place for some of them that came express and repainted to local. The articulates are being replace on scheduled with some being part of the current order. Some 0600 and 0700 will hang around until 2024 next order.
Don't see any increase in services or the need for expansion under council current thinking for a few years due to the higher cost going to all Hybrid buses now, It will become worse once we move to ebuses. Then us have the declining fuel taxes to add the funding as we move to battery power vehicles.
For a city of its sizes using a 30% model split, it should see an average of about 500,000 trips today, but only seeing 250,000 which is not much different from 2003.
As long as the city keeps high density in only a few areas, most routes will see low ridership and poor quality of service.
I would love to see what the ridership numbers are for Brampton 502 just for Mississauga to see where ridership is for Hurontario as its still the number 1 route for Mississauga using current numbers for it. Giving the shortness of the 103 route these days, it still carries close to 50% of the ridership that reinforce the needs to have an LRV bypassing Sq One CCTT as well the future LRT loop.
With the city moving to design stage for part of the the BRT line for Dundas and Lakeshore, those routes will see better service, but no density to support it.
On next week's General Committee agenda there is a report requesting pre-budget approval to purchase 82 40' buses in 2024 to replace the 2007 and 2008 40' buses. Tender will be issued in March and delivery of buses targeted for Q2 2024. https://pub-mississauga.escribemeetings.com/filestream.ashx?DocumentId=37597


