


ShonTron
Moderator
Member Bio
- Joined
- Apr 24, 2007
- Messages
- 13,267
- Reaction score
- 12,018
- Location
- Ward 13 - Toronto Centre
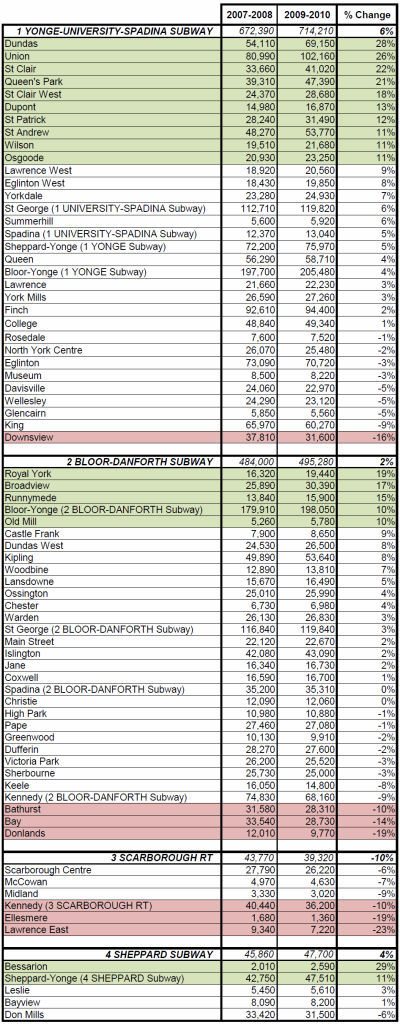
There's a little project I'm working on and want to to confirm that the most recent number for Sheppard 45,859 is representative of the daily Sheppard Subway ridership.
I'm going to disprove some myths.
I'm going to disprove some myths.