News   Apr 25, 2024
 197     0 
News   Apr 25, 2024
 354     0 
News   Apr 25, 2024
 552     0 

Cycling infrastructure (Separated bike lanes)

That being said, the Sherbourne barriers look more like curbs, which cars can easily jump.
I just cross posted exactly that point! Absolutely, you 'intuite' it too. As a runner, the defence is the same as a cyclist: Always assume they don't see you, and even if they do, and decide to 'pull rank'(which legally isn't, pedestrians and cyclists preceding have the RoW)...you're a sitting duck.
 
For sure. Running is a bitch in that one is moving faster than drivers anticipate pedestrians to normally move, and I've had a few close ish calls because of it. I don't blame drivers in this case because sightlines are usually bad.
 
I honestly don't mind the sherbourne "hoppable curbs" - it does lead to some park in bike lane problems, but generally drivers seem to respect it, and it allows you to easily pass another slow cyclist when there is a gap in traffic. You can't do that on the Wellesley lanes, with their "hard curbs".
 
In the morning and afternoon rush, more commuters now bike in and out of downtown on the roads than drive them.

I'd really like to see where that figure is coming from. Back when the city studied the Gardiner East (since it was mentioned in the article), it said that there's ~45,000 cars driving into downtown in the morning peak hour (here's a link), which is 10,000 more than the number of people who bike to work anywhere in Toronto (from the 2016 census).
 
I'd really like to see where that figure is coming from. Back when the city studied the Gardiner East (since it was mentioned in the article), it said that there's ~45,000 cars driving into downtown in the morning peak hour (here's a link), which is 10,000 more than the number of people who bike to work anywhere in Toronto (from the 2016 census).
Geez...I've asked you before, but it just doesn't sink in: How many of those trips are *headed to the core*? And at what times?

And the really big one which you've been called on umpteen times:
1548104641508.png


Walk Cycle 4%
Gardiner East 3%
https://www.toronto.ca/legdocs/mmis/2015/pw/bgrd/backgroundfile-80083.pdf

Eight years ago!
 
Last edited:
Geez...I've asked you before, but it just doesn't sink in: How many of those trips are *headed to the core*? And at what times?

And the really big one which you've been called on umpteen times:
View attachment 171710

Eight years ago!
This source from april of 2018 says that 36% of people working downtown get to work in a private vehicle (pg 19). 2% enter by walking or cycling. No way whatsoever does cycling exceed any other mode, yet alone driving.

I don't get why are are dying on this hill - it's pretty clear that the star article was solely referring to Richmond and Adelaide streets themselves, which handle only a minutia of total vehicle traffic in and out of the core.
You mean this "Cordon Count"?
Volunteer bike counters step up to gather the data the city should be collecting: Keenan
By EDWARD KEENANColumnist
Tues., Oct. 3, 2017

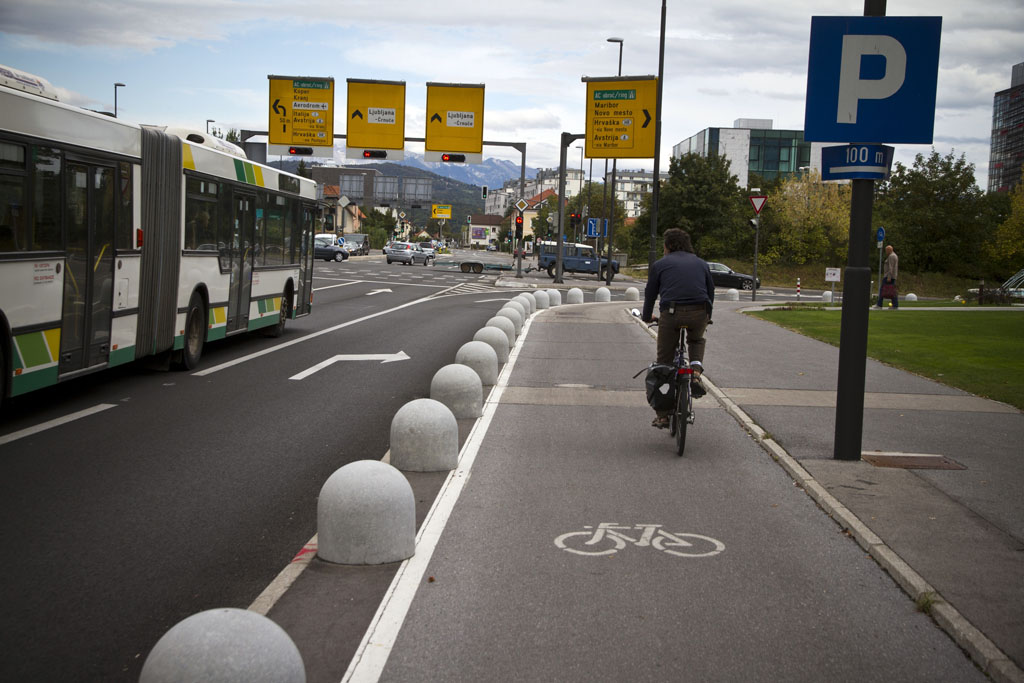
You might have seen them out on the sidewalk Tuesday morning, on the edges of downtown along Spadina, Jarvis, Queens Quay and Bloor, with clipboards and video cameras, counting. A platoon of volunteers, doing the work they think the city should be doing.
They were counting bikes, and will continue to do so Wednesday and Thursday. It’s a “cordon count” at 34 locations around the downtown core, attempting to estimate the total number of bikes entering the area during the morning rush.

“I’m someone who believes very strongly in evidence-based decision-making,” says Gil Meslin as he makes hash marks on a clipboard tracking the number of cyclists coming eastbound through the intersection at Adelaide and Spadina. “I’ve seen the city and the mayor deciding increasingly to go the other way on many major decisions,” he says, picking out one piece of data to fixate on, or one anecdote or emotional thread in a debate. “In my mind, any data point that’s current and relevant can only be a positive contribution to the process.”
Meslin is the organizer of the entirely volunteer, “citizen-led” cordon count. He says the idea came to him because the city doesn’t really have any publicly available, up-to-date information about the number of cyclists entering the downtown core.
One cordon count was conducted in 2010, its results still available on the city’s website. At the time, the plan was to replicate the count every year. But it appears that plan was abandoned. It seems the city may have done such a count in 2014, but if it did the results have not been released publicly. So Meslin, a city planner working in the private sector who is also interested in municipal affairs and transportation advocacy, saw a gap in the information available in our debates.
“Unlike intersection counts or lane counts, where you see how traffic has changed at a particular point, a cordon count shows you system-wide change: how traffic has changed over time across the whole downtown, how behaviour is changing across the city.”
It could be useful for tracking the demand for cycling infrastructure, for instance. And for seeing how the introduction of bike paths (on Adelaide and Queen’s Quay, for instance) has changed cycling system-wide: has the number of people cycling into the core gone up, or have people just changed their route to take advantage of the new infrastructure? How much more likely are people to use one route over another? Where are the heaviest-trafficked routes that do not have bike lanes? A cordon count showing total volume at most major locations from 2017 that could be compared to the earlier data might answer some of those questions.
So Meslin used his Twitter account to put out a call for volunteers, proposing to replicate the methodology of the 2010 study. He got more than 70 responses, and on Tuesday morning said there were about 50 volunteers in the field. They don’t have the human resources to replicate the entire 2010 study, which tracked counts at the 34 locations over a 12-hour period, so they are focusing on the morning peak, 7 a.m to 10 a.m.
“We want to be able to make an apples-to-apples comparison, using the same locations, the same time of day, the same criteria. If there are changes, that tells you something,” Meslin says, noting he won’t try to anticipate what, if any, changes the data may show. He has some volunteers who are professional data analysts and transit engineers to help evaluate the data once it’s collected.
But for now, he’s busy enough collecting the data. The cyclists come in waves through the intersection as the lights change, and Meslin quickly scratches a tally — segmented into 15-minute increments — as they pass. In the peak hour as the sun rises higher and the commuter crush gets heavier, it becomes hard to keep up. Between 7:00 and 7:15, his tally sheet only shows 35 cyclists passing. Between 8:45 and 9:00, the boxes on the sheet overflow with 325 marks. Meslin has a video camera mounted on a tripod to back up his notes.

He says he expects this first attempt will be a starting point — that they’ll be able to improve and refine the process to get better, more reliable data for future counts. “Not every area lends itself to the democratization of information gathering,” he says, in which volunteer amateurs provide the city with statistics. There are some kinds of surveys in which methodological or observational expertise is warranted. But when it’s as simple as counting on the street corner, perhaps there’s an opportunity for the city to work with interested citizens to fill its own informational gaps.
To me, it’s a puzzle why the city wouldn’t be gathering what seems like such basic information on its own — how can we have an intelligent debate about cycling infrastructure in the downtown core without knowing how many people cycle into the downtown core, and where, and when? I think the city should be gathering such information, and making it available.
But if the city won’t, it’s a relief to find out that somebody will.
https://www.thestar.com/news/gta/20...ata-the-city-should-be-collecting-keenan.html

You'll note that what's quoted in that City report https://www.toronto.ca/wp-content/uploads/2018/04/9700-downtown-mobility-strategy-city-panning.pdf doesn't jibe with other city reports.

More later, I'll update this when I get time, more important points beckon right now.

Quick addendum:
Regardez! The Cordon Count referenced from what Amnesia links makes no sense compared to the one the City links here:
https://www.toronto.ca/wp-content/uploads/2018/04/9700-downtown-mobility-strategy-city-panning.pdf


More comment on this later...
 
it's pretty clear that the star article was solely referring to Richmond and Adelaide streets themselves, which handle only a minutia of total vehicle traffic in and out of the core.

Yes, seems like that's the case.
 
RE: "Sherbourne Street cycle lane curbs": (as proposed by the City for the Adelaide bike lane relocated on the north side)
I'm a little puzzled though by the reference to "Sherbourne St". I'd call that a curb, not a "raised concrete barrier"...the latter of which is absolutely needed. The immediate problem with lanes being on the north side of Adelaide is that motorists have an ingrained (if that) sense to look for bikes over the other shoulder/in the other mirror, and won't check for them on the left. A raised curb a la Sherbourne or Roncy won't deflect them if they veer left w/o looking. A "raised concrete barrier" will.
That being said, the Sherbourne barriers look more like curbs, which cars can easily jump.

The Fixer: Low curbs on Sherbourne St. bike lanes invite drivers to park on them
By JACK LAKEYThe Fixer
Sun., Oct. 7, 2012
[...]
Sherbourne lanes, which separate cyclists from traffic, will be a key north-south route for bike riders.
We’ve seen two photos of a UPS parcel truck that had mounted the barrier and parked in the bike lane, including one sent to us by Alan Heisey, an avid cyclist and former chair of the Toronto Police Services Board.
Heisey raised the same question as Kolb: “Will the police enforce the new bylaw?”
When we checked it out last week we were surprised the curbs are so low and rounded on top; it’s like an invitation to drivers to park.

Many of the buildings north of Carlton have laneways that require the curbs to be cut down even with the pavement, making it even easier for a vehicle to breach the cycling lane.
Dan Egan, Toronto’s manager of cycling infrastructure, said the curbs had to be designed to allow police vehicles, ambulances and fire trucks to pull over them in emergencies.
“It’s not an ideal situation,” said Egan. ‘If we had a lot wider street, it would have been a much simpler design.
“This is the challenge of trying to do a separated bike lane on such a narrow two-way street.”
While the “rolled” curbs are easy for vehicles to mount, Kolb noted that they are too high for cyclists to ride over.
“When a cyclist is blocked by a parked car, they literally have to dismount and walk into traffic or go up on the sidewalk,” he said. “It’s dangerous and disrespectful.[...]
https://www.thestar.com/yourtoronto...ike_lanes_invite_drivers_to_park_on_them.html
 
Last edited:
^Excellent article. I'd missed this one linked at the above article:
Bike lanes prove that transportation solutions can be cheap and effective
By EDWARD KEENANStar Columnist
Fri., Jan. 11, 2019
[...]
The success of the King St. streetcar pilot project, which appeared to have added about 12,000 to 14,000 riders per day (to a total of about 84,000 riders) in the year after some quick changes to the street to give the transit vehicles priority at a cost of about $1.5 million, has been held out as one obvious example of that philosophy providing a quick win. The success of the Richmond-Adelaide bike lanes, at a cost of a few hundred thousand dollars for installation, seems to make the point all the more vividly.
These two transportation projects, installed in months at a total cost of less than $3 million, have brought about 20,000 new commuters travelling into the downtown core each day while making the roads safer and without making commute times dramatically worse for anyone.
[...]
https://www.thestar.com/opinion/sta...ion-solutions-can-be-cheap-and-effective.html
 
Seen the city lower the speed limits on roads from 60 km/h to 50 km/h. However, the width of the traffic lanes remain the same. The roads, especially the suburban arterial roads, were built for 60+ (emphasis on the "+", for "safe" at "high" speed).

The city should have reduced the traffic lanes to force the motor vehicles to travel at a slower speed. At the same time, we could have installed bicycle lanes within those extra space left over.

The boulevards are used for snow windrows in winter. Those boulevards could be incorporated into a wider shoulder and used for a more enhanced separate bicycle lanes for the three seasons where the snow windrows wouldn't be a problem.
 
Some of the arterial roads in north Scarborough have recently been resurfaced with narrower lanes painted. Speed limits were not reduced to 50 km/h, however. There's still not enough room for bike lanes in the extra space.

Here's an example: Birchmount Road south of Steeles

However, looking at that green grass boulevard between the traffic lanes, the bicycle lanes, and the sidewalk, they could convert some of that grass for the bicycle lane. Still have space for snow windrows, but get wider bicycle lanes.

EXPLORE-slovenia-mikael-colville-andersen-3.jpg

From link.

What would have been better was to shift the curb closer to the traffic lanes, in exchange put the bicycle lanes (using different material) next to the pedestrian sidewalk.

blog-bike-lane-3-300x225.jpg

From link.
 

Back
Top