News   Apr 19, 2024
 1K     0 
News   Apr 19, 2024
 694     2 
News   Apr 19, 2024
 1.1K     3 

VIA Rail

New tender on MERX:

20-JPO08 - Public Consultation Services for the VIA High Frequency Rail (HFR Project)

I presume this means the Engineers hired in January (AECOM and Arup) have been able to show it's a viable proposal, and it's progressing from the "can it be done" stage to "how do we build it" stage.
 
At the same time, if one could produce data showing that ridership would double, at a consistently low fare, and without subsidy - there might still be a valid pitch. A "train every hour, no need to reserve, just show up" type service might just assure that.

I think this is wishful thinking on the part of rail fans. And most certainly this is leaves an opening for anyone with an agenda. From the likes of Paul Lanagan to the Conservative politicians wanting to rail against wasteful spending.

The whole reliability argument is a tough sell, because most of the public just won't buy something like that up front. Even price might be a tough sell because VIA has gotten a reputation for being expensive.

I would argue that political saleability is based on a few points:

1) Faster than today. Toronto-Montreal has to be faster than the fastest express today. Even if it's by 10 mins. After that, they'll have to argue hard that it's faster on every trip but Toronto-Montreal.

2) Cheaper than today. Or at least a firm pledge to not raise prices.

3) Frequency. I think this is a highly sellable attribute. VIA needs to pitch it as flexibility though. They might need to do more than hourly departures.


That last billion dollars to improve the speed is crucial. I sure hope the business case captures how a faster timing would advance the project's value proposition.

Yep. I really hope there are good value and trade off models. Personally, my completely uneducated guess would be the sweet spot might be closer to $6B for the unelectrified rail with all of the issues discussed here. I would guess that gets them to < 3 hrs to Ottawa and < 4.5 hrs to Montreal, from Toronto.
 
I presume this means the Engineers hired in January (AECOM and Arup) have been able to show it's a viable proposal, and it's progressing from the "can it be done" stage to "how do we build it" stage.

We hope. I wouldn't say that's a certainty.
 
I presume this means the Engineers hired in January (AECOM and Arup) have been able to show it's a viable proposal, and it's progressing from the "can it be done" stage to "how do we build it" stage.

Has there ever been a government-hired contractor at the feasibility/consultation stage say 'nope, dumb idea; here's our bill, we're outta here'.?
 
Has there ever been a government-hired contractor at the feasibility/consultation stage say 'nope, dumb idea; here's our bill, we're outta here'.?

Yeah; thousands of government feasibility studies show achieving the stated goal will cost more than expected or ROI is less than hoped. Sometimes the budget scales up but just as often it's quietly deferred then firmly killed when leadership changes; all those proposals which do a short study then don't happen. High Speed Rail being a recurring example in Canada.
 
Last edited:
First, here's the summary of what I found in the document :

screen-shot-2020-09-08-at-9-22-48-am-png.268257


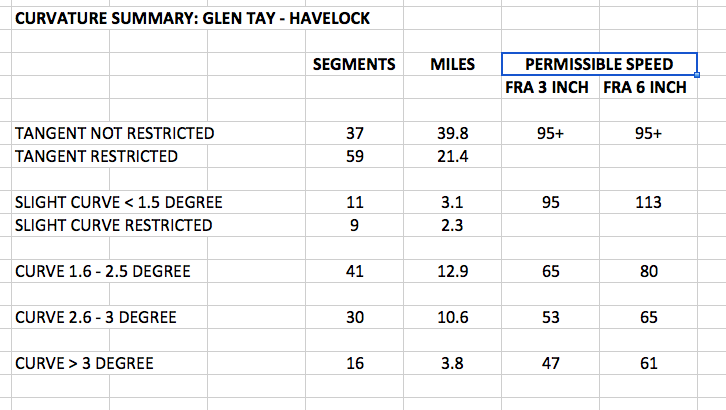
Translation: There are 86 segments where the as-exists curvature exceeds 1.5 degrees. At that curvature, a "typical" train would have to reduce speed to negotiate the curve. My assumed "typical" train is the equivalent of an LRC with tilting deactivated - ie, assumed track superelevation (banking) of 3 inches, and equipment with a "cant deficiency" rating of 3 inches. (I pulled the LRC specs from memory, and may not be accurate, but it's just a straw man anyways) The speeds shown under the "FRA 3 inch" collumn are the speed allowed by the US Federal Railroad Administration for that track profile. (Note that the length of the curve does not affect the restriction - although a longer curve will require holding that train to the restricted speed for a greater distance).

So, under this baseline, in the 94 miles from Havelock to Glen Tay, a "typical" train would have to navigate 3.8 miles at 47 mph, 10.6 miles at 53 mph, and 12.9 miles at 65 mph.

Of the remaining track, trains could run 42.9 miles at 95 mph+. Because of all the slow segments, there are about 23.7 miles of track that is straight, but is adjacent to the slow bits, so trains would have to be accelerating/decelerating through these segments. These segments while straight consequently must be considered "restricted" by all the slowing down and speeding up.

The question is, what can VIA do to improve on this? One solution would be to increase the banking of the curves and/or use a tilting train that can handle curves faster. The collumn "FRA 6 inch" shows the speed restrictions that would translate to "LRC train with banking operating as designed" - ie 3 inch superelevation, 6 inch cant deficiency. As you can see, if VIA either found a tilting train, and/or banked the curves more, speeds through all those tight curves would rise.
For the benefit of those people who struggle to understand the interplay between degree of curvature, radius, balanced superelevation and unbalanced superelevation (the latter being what Paul calls "cant deficiency"), I'm copying the relevant section from my Masters Thesis:

5.7.2. Local speed limits

The main factor affecting local speed limits is the curvature of specific line segments and the applicable superelevation. In order to offset the centrifugal forces, which may cause anything between passenger discomfort and train derailment if the train takes the curve at an excessive speed, the outer rail is usually elevated so that the train tilts slightly towards the inner of the curve, thus creating some gravitational forces which act in the opposite direction of the centrifugal forces. In addition, railroads often apply a so-called “unbalanced superelevation”, which is the increment by which the equilibrium superelevation (i.e. the superelevation which would be needed to completely offset – or: balance – the gravitational forces) exceeds the actual superelevation applied to the curve.

Railroads in North America generally apply the formula shown in Figure 19 to determine the equilibrium superelevation. Given that the formula does not treat actual and unbalanced superelevation differently, it is sufficient to determine one single value for the maximum permissible superelevation. While FRA regulations allow up to 3 inches of unbalanced superelevation and a maximum actual superelevation of 7 inches on Track Classes 3 through 5 [21], the limit of 5 inches of total superelevation used by Caltrain in California for their own urban mixed-operation rail corridors (Caltrain, 2011) seems to be a reasonable assumption to be adopted within this thesis.

1599622912667.png


Starting from the first equation provided in Figure 19, we can isolate the maximum permissible degree of curvature, which then becomes an input for a different equation (Calvert, 2004), which can be used to calculate the minimum permissible radius for the 5mph-increments shown in Table 17 [23]:

1599622761611.png

1599622869182.png


[...]

[21] It should be noted that the track classes defined by the FRA are slightly different than those defined by Transport Canada and that, for instance, the maximum speed of Track Class 5 is 90 mph (145 km/h) rather than 95-100 mph (153-161 km/h) north of the border.
[23] It should be noted that the degree of curvature (𝐷𝑐) needs to be converted to radians before being inserted into Equation 2.1.

I've created a more detailed version of "Table 17" to show the degree of curvature and radius for an equilibrium superelevation between 1 and 10 inches and speeds between 15 and 200 mph and if you refer back to the first table from Paul's post I quoted above, it becomes clear that the "FRA 3 INCH" and "FRA 6 INCH" columns presented by him assumes 2 inches of cant deficiency (unbalanced superelevation) for a total superelevation of 5 and 8 inches, respectively:
1599623989911.png
 
Last edited:
I've created a more detailed version of "Table 17" to show the degree of curvature and radius for an equilibrium superelevation between 1 and 10 inches and speeds between 15 and 200 mph and if you refer back to the first table from Paul's post I quoted above, it becomes clear that the "FRA 3 INCH" and "FRA 6 INCH" columns presented by him assumes 2 inches of cant deficiency (unbalanced superelevation):

Thanks for the table, it's very informative! For others' reference, here are some numbers I pulled from it:

Based on the typical 560-metre radius present on the eastern segment of the Havelock sub, here's the applicable speed limits from the right table given different equilibrium (total) superelevation:

1": 20 mph (32 km/h)
2": 30 mph (50 km/h)
3": 35 mph (56 km/h)
4": 40 mph (64 km/h)
5": 45 mph (72 km/h)
6": 50 mph (80 km/h)
7": 55 mph (88 km/h)
8": 60 mph (97 km/h)
9": 60 mph (97 km/h)
10": 65 mph (105 km/h)

The relationship between the various superelevation values is:
Equilibrium (Total) superelevation = Actual superelevation + Unbalanced superelevation (Cant Deficiency)

Transport Canada seems to take 3" cant deficiency as a given, so the aforementioned 3" and 6" actual superelevation options would correspond to 50 mph (80 km/h) and 60 mph (97 km/h) respectively on the eastern half of the Havelock sub.

I think that VIA could justify quite a high level of actual superelevation east of Havelock, since they could completely prohibit freight trains. Transport Canada permits up to 7" actual (10" total), though they place very strict maintenance regulations on tracks above 6" actual. I think it's safe to assume VIA would use either 6" or 7" actual (9" or 10" total).
West of Havelock the total superelevation would need to be lower since CP will retain running rights, perhaps 5" total like your CalTrain example. Thankfully that segment has larger curve radii anyway.
 
Last edited:

Details below:
Key Public Consultation Consultant (PCC) Activities
The PCC’s role during this pre-procurement due diligence and de-risking Phase 2 is to support the JPO team with all matters related to public and stakeholder engagement, excluding the Indigenous and Metis community consultations, as well as activities related to the Impact Assessment process under the IAAC which are under the primary responsibility of the OE advisor. The PCC must also support the JPO on communication and media relations activities and will form, along with the OE advisor, an integral part of the JPO team to achieve social acceptability.
For greater certainty, the PCC is acting under the direction of the JPO Project Director and the Communications Lead.
The detailed scope of work of the PCC is outlined in Schedule A, Services and Deliverables, of this RFP.

A lot of classic consulting language where you spend millions to hire a team of consultants to produce a series of Powerpoint deliverables that support your initial hypothesis. Oh and it's a year long and likely doesn't include travel and other contingency expenses (billed separately to the government).

Nonetheless, this is a good sign, and shows that we are slowly, gradually putting more and more $$ into HFR, and walking the talk.
 
^Here I am once again behind the curve in terms of jargon. Is the IAAC just a new term for a federal Environmental Assessment? Or is it different somehow?

I'm very happy to see public consultations, but the cynic in me can't help but react to the bureaucratic jargon. The process seems to have split the consultation and outreach into silos.... one wonders how much more complicated it could get. Left hand - right hand issues? Every government department trying to get a meal ticket out of HFR without actually being accountable for delivering any of it?

Trying to stay positive.....

- Paul
 
I'm pretty sure the Liberals mandated separate consultations for impact on First Nations a long time ago. It's a normal part of the process. The question is when are we going to see shovels in the ground. At this rate, it won't be till 2022 at the earliest. And completion is probably 2027.

I'm hoping there's phasing which can at be least deliver immediate benefits. For example, it's been mentioned before that Ottawa-Montreal would cost $90 million. I wonder if that is something they can deliver in a year. Toronto-Peterborough is also something I would think they could deliver before the whole corridor.

When I think that in 2030, after billions of dollars spent, we'll have service that is slower than the Turbo from a half century ago, it does make me a little sad. I can understand why people like Paul Lanagan are frustrated. Even if they are misguided....
 
There's an old saying..... "Be careful what you ask for" ;-)

[...]

@UrbanSky, I'd love your input - but if this treads a little too closely to things for comfort, I'm sure that others can play with the spreadsheet. Just insert whatever speeds you want to examine.

- Paul
I've been pondering about the extent to which extent I can implicate myself in the joint effort of modelling travel times for the HFR route and I believe that I will draw the line by taking the model I developed for my Master Thesis, apply it to the HFR route on the existing ROWs route and then hand the file over to you to play around with whatever realignments or bypasses you can think of.

However, at every step, I have to be transparent about where my assumptions come from (e.g. from my Thesis rather than anything I might or might not have seen at work), which means I need to first explain to you how I arrived to the adapted model and I'll loosely follow the structure I used in my Thesis:
  1. Parameters
    1. Train
    2. Superelevation
  2. Data
    1. Route
    2. Curves
  3. Modelling
    1. Speed limits
    2. Uniform acceleration
    3. Fixed blocks vs. variable blocks
  4. Model Solving
    1. Ignoring s-curves
    2. Respecting s-curves

Okay, shall we?

1. Parameters
1.1 Train


The only practical way to model train running times is to assume uniform acceleration, by which only two parameter determine a train's capabilities to accelerate and decelerate (one parameter for each) along its route, which I explained in all detail in Section 6.2.

As you could also read in Section 5.3, I selected four different train types for the Toronto-Kitchener service I was modelling:

1600651140072.png

Source: my Master Thesis (p. 60)

Needless to say, that the "Inter-City" train is the most appropriate train profile as the closest equivalent to the Siemens trains which would serve the HFR route.


1.2 Superelevation

As I explained in Subsection 5.7.2, I identified that the maximum allowable total superelevation (note that this is the sum of balanced and unbalanced superelevation) under FRA rules is 10 inches, but opted to only assume the same 5 inches which Caltrain's host railways were willing to accept for its commuter rail network. I found an interesting article (on p. 24) about Brightline in which they mention that its host railroad's tracks (i.e. those of FEC) were banked by 2 inches of actual banking (i.e. balanced superelevation), which suggests that the 3 inches of "cant deficiency" (i.e. unbalanced superelevation) Paul has mentioned are an industry standard. More interestingly, it mentions that the actual banking along the shared segments was increased to 5 inches, which presumably translates to a total superelevation of 8 inches. Given that a passenger railroad was able to obtain 5 inches of banking from its host railroad, it appears reasonable to assume that a passenger railroad sharing its own tracks with infrequent freight trains could at least impose the same banking onto its curves. Therefore, I will assume a total superelevation of 8 inches for modelling the HFR route.

Unfortunately, "s-curves" (e.g. a right-curve directly leading into a left-curve) pose a problem here: the more banking is applied to the curves, the earlier the banking has to start so that the target value has been achieved before the train enters into the curve (and the same has to be reversed at the end to the curve until the tracks are horizontally levelled). I will therefore limit the total superelevation to 5 inches for any adjacent curves which bend in opposite directions.

The last point actually brings me to a remark towards the many friends of tilting trains here: the only thing what a titling train does is increasing the cant deficiency by adding an additional superelevation to the banking which was already applied to the route (thus offsetting part of the underbalance which results from the centrifugal forces at the speed at which the train travels around the corner. However, in the context of s-curves a tilting train which tilts with an additional 2 inches (to throw a number around) over a curve with a banking of 5 inches has the same total superelevation (i.e. banking of tracks plus permittable cant deficiency plus the banking of the train, thus: 5+2+3=10 inches) as a conventional train train operating over a curve with a banking of 7 inches and thus requires the same distance to become horizontally levelled without passengers becoming uncomfortable. Therefore, even if an FRA-compliant non-electric tilting train design was available for the North American market (I'm not aware of any), it would not allow to run faster around s-curves than the non-tilting train which is currently in production for VIA...


2. Data
2.1 Route


I extracted the routing from the excellent Ontario Railway Map Collection and only modified the relevant lines to cut them as required (and to make them meet each other at Agincourt). The only line I actually had to draw was the bypass northwest of Smiths Falls, for which I simply placed a circle with a radius of 3000 meters (i.e. sufficient to allow a maximum speed of 110 mph even with a total superelevation of only 2 inches, see next section), which touched the lines extended from the Smiths Falls and Belleville Subdivisions:
1600654892343.png


The result is the following route:
1600738734081.png


2.2 Curves

Let's move on to the tricky part, the curves: using the only perk of Google Earth Pro about which I care (i.e. the circle drawing tool), I have measured every single curve I could spot (by drawing tangent lines between those curves I could spot) - and believe me, there are a lot! Long story short, I identified 270 curves along the alignment, of which 229 were located on the Havelock Subdivision (thus 85%, despite only accounting for only 73% of the total distance:

1600738815688.png


No less surprising, the most Eastern segment of the Havelock Subdivision (i.e. between Tweed and Glen Tay) has 8 times as many curves (per 100 km) as the Smiths Falls Subdivision:

1600738592865.png


Before I continue with determining the speed limits, I'll give you my .kmz file and some time to explore the curves I've identified and to find any curves I might have missed. Also, please let me know if you have any questions so far or struggle to see where I derived my assumptions from! As I said at the beginning, full transparency and exclusive dependence on publicly accessible sources is the only way for me to help you with modelling the HFR route...
 
I've been pondering about the extent to which extent I can implicate myself in the joint effort of modelling travel times for the HFR route and I believe that I will draw the line by taking the model I developed for my Master Thesis, apply it to the HFR route on the existing ROWs route and then hand the file over to you to play around with whatever realignments or bypasses you can think of.

However, at every step, I have to be transparent about where my assumptions come from (e.g. from my Thesis rather than anything I might or might not have seen at work), which means I need to first explain to you how I arrived to the adapted model and I'll loosely follow the structure I used in my Thesis:
  1. Parameters
    1. Train
    2. Superelevation
  2. Data
    1. Route
    2. Curves
  3. Modelling
    1. Speed limits
    2. Uniform acceleration
    3. Fixed blocks vs. variable blocks
  4. Model Solving
    1. Ignoring s-curves
    2. Respecting s-curves

Okay, shall we?

1. Parameters
1.1 Train


The only practical way to model train running times is to assume uniform acceleration, by which only two parameter determine a train's capabilities to accelerate and decelerate (one parameter for each) along its route, which I explained in all detail in Section 6.2.

As you could also read in Section 5.3, I selected four different train types for the Toronto-Kitchener service I was modelling:

View attachment 270743
Source: my Master Thesis (p. 60)

Needless to say, that the "Inter-City" train is the most appropriate train profile as the closest equivalent to the Siemens trains which would serve the HFR route.


1.2 Superelevation

As I explained in Subsection 5.7.2, I identified that the maximum allowable total superelevation (note that this is the sum of balanced and unbalanced superelevation) under FRA rules is 10 inches, but opted to only assume the same 5 inches which Caltrain's host railways were willing to accept for its commuter rail network. I found an interesting article (on p. 24) about Brightline in which they mention that its host railroad's tracks (i.e. those of FEC) were banked by 2 inches of actual banking (i.e. balanced superelevation), which suggests that the 3 inches of "cant deficiency" (i.e. unbalanced superelevation) Paul has mentioned are an industry standard. More interestingly, it mentions that the actual banking along the shared segments was increased to 5 inches, which presumably translates to a total superelevation of 8 inches. Given that a passenger railroad was able to obtain 5 inches of banking from its host railroad, it appears reasonable to assume that a passenger railroad sharing its own tracks with infrequent freight trains could at least impose the same banking onto its curves. Therefore, I will assume a total superelevation of 8 inches for modelling the HFR route.

Unfortunately, "s-curves" (e.g. a right-curve directly leading into a left-curve) pose a problem here: the more banking is applied to the curves, the earlier the banking has to start so that the target value has been achieved before the train enters into the curve (and the same has to be reversed at the end to the curve until the tracks are horizontally levelled). I will therefore limit the total superelevation to 5 inches for any adjacent curves which bend in opposite directions.

The last point actually brings me to a remark towards the many friends of tilting trains here: the only thing what a titling train does is increasing the cant deficiency by adding an additional superelevation to the banking which was already applied to the route (thus offsetting part of the underbalance which results from the centrifugal forces at the speed at which the train travels around the corner. However, in the context of s-curves a tilting train which tilts with an additional 2 inches (to throw a number around) over a curve with a banking of 5 inches has the same total superelevation (i.e. banking of tracks plus permittable cant deficiency plus the banking of the train, thus: 5+2+3=10 inches) as a conventional train train operating over a curve with a banking of 7 inches and thus requires the same distance to become horizontally levelled without passengers becoming uncomfortable. Therefore, even if an FRA-compliant non-electric tilting train design was available for the North American market (I'm not aware of any), it would not allow to run faster around s-curves than the non-tilting train which is currently in production for VIA...


2. Data
2.1 Route


I extracted the routing from the excellent Ontario Railway Map Collection and only modified the relevant lines to cut them as required (and to make them meet each other at Agincourt). The only line I actually had to draw was the bypass northwest of Smiths Falls, for which I simply placed a circle with a radius of 3000 meters (i.e. sufficient to allow a maximum speed of 110 mph even with a total superelevation of only 2 inches, see next section), which touched the lines extended from the Smiths Falls and Belleville Subdivisions:
View attachment 270752

The result is the following route:
View attachment 270944


2.2 Curves

Let's move on to the tricky part, the curves: using the only perk of Google Earth Pro about which I care (i.e. the circle drawing tool), I have measured every single curve I could spot (by drawing tangent lines between those curves I could spot) - and believe me, there are a lot! Long story short, I identified 270 curves along the alignment, of which 229 were located on the Havelock Subdivision (thus 85%, despite only accounting for only 73% of the total distance:

View attachment 270945

No less surprising, the most Eastern segment of the Havelock Subdivision (i.e. between Tweed and Glen Tay) has 8 times as many curves (per 100 km) as the Smiths Falls Subdivision:

View attachment 270943


Before I continue with determining the speed limits, I'll give you my .kmz file and some time to explore the curves I've identified and to find any curves I might have missed. Also, please let me know if you have any questions so far or struggle to see where I derived my assumptions from! As I said at the beginning, full transparency and exclusive dependence on publicly accessible sources is the only way for me to help you with modelling the HFR route...

Insightful! Thank You!

I look forward to further informed exchange between yourself and @crs1026
 
In the meanwhile, I will provide you with a quick update for the latest round of timetable changes in the Corridor, which will take effect September 29:

Whereas additional frequencies have been added on September 1 (second round-trip TRTO-WDON and third round trips on QBEC-MTRL-OTTW, MTRL-TRTO and TRTO-OTTW) and September 11 (fourth round-trip operating Mondays, Fridays and Sundays only on MTRL-TRTO and OTTW-TRTO), this timetable change only concerns which trains operate when:
  • Train 39 will be replaced by train 37
  • Train 66 will now operate only Mondays, Fridays and Sunday (was: daily)
  • Train 68 will now operate daily (was: Mondays, Fridays and Sundays only)
  • Train 71 will operate almost 2 hours later
  • Train 669 will be replaced by a retimed train 69
  • Various trains have been revised by just a few minutes

I will provide the departure times like I did in my last post (with all changes in red):
  • Quebec-Montreal (and v.v.)
    • leaving QBEC at 08:00 (#35), 13:00 (#37) and 17:45 (#29)
    • leaving MTRL at 08:56 (#22), 12:45 (#24) and 18:25 (#28)
  • Montreal-Ottawa (and v.v.)
    • leaving MTRL at 09:00 (#633), 12:04 (#35) and 16:50 (#37)
    • leaving OTTW at 06:30 (#22), 10:15 (#24) and 16:10 (#28)
  • Montreal-Toronto (and v.v.)
    • leaving MTRL at 08:55 (#63), 11:05* (#65), 13:28 (#67) and 17:10 (#69)
    • leaving TRTO at 08:32 (#62), 11:32 (#64), 15:17* (#66) and 17:02 (#68)
  • Ottawa-Toronto (and v.v.)
    • leaving OTTW at 08:40 (#643), 11:50 (#53), 15:23* (#55) and 18:25 (#59)
    • leaving TRTO at 08:32 (#52), 12:17 (#42), 15:32* (#46) and 18:47 (#48)
  • Toronto-Windsor (and v.v.)
    • leaving TRTO at 08:40 (#71) and 17:30 (#75)
    • leaving WDON at 09:00 (#72) and 17:45 (#78)
  • Toronto-Sarnia (and v.v.)
    • leaving TRTO at 17:40 (#84)
    • leaving SARN at 06:10 (#87)
Note: all trains will operate daily, except trains marked with an asterisk (*), which will operate on Mondays, Fridays and Sundays only.

PDF timetable available here: https://www.viarail.ca/sites/all/files/media/pdfs/schedules/September29.pdf

Concerning the non-Corridor routes, MTRL-JONQ, MTRL-SENN, SUDB-WHTR and JASP-PRUP continue to operate only once per week and the Canadian and Ocean have been suspended since mid-March, which makes the WNPG-CHUR train the only train operating under its regular schedule (though without sleeper accommodations).

As I said last time, I'm happy to finally be able to present you a somewhat usable schedule. Let's hope the best... #secondwave
 
Last edited:

Back
Top