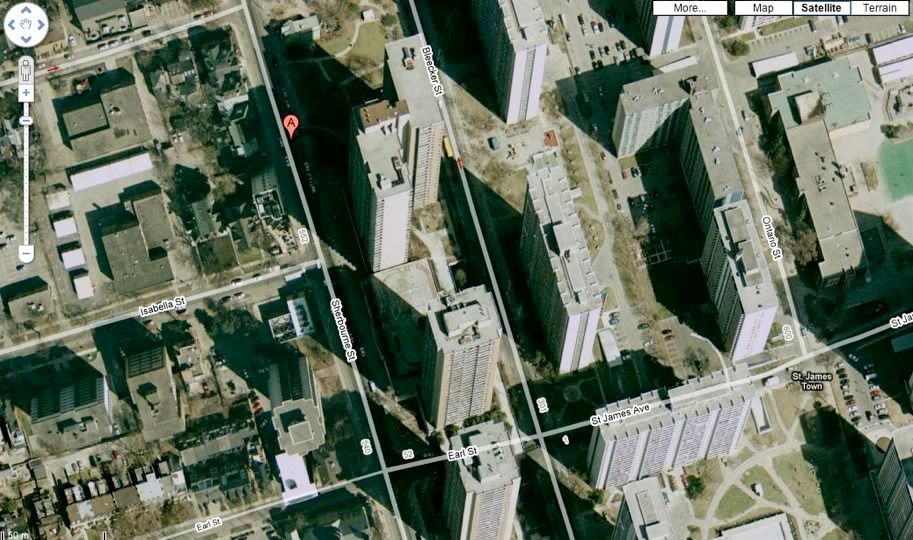
You got me thinking Redroom, so I did some quick research. The chart below is from the accompanying link and is from Jan 2007. The first # is the population of the city, the second # is the land area and the third # is the population per square kilometre. Toronto is #97, San Fran #104 and New York #114. Mumbai is #1 with 29,650 people per square kilometre. St. James Town has an area of 1/4 of a square kilometre with a population of about 20,000 people. That translates into 80,000 people per square kilometre!
http://http://www.citymayors.com/statistics/largest-cities-density-125.html
Largest cities in the world ranked by population density (1 to 125)
Rank City / Urban area Country Population Land area
(in sqKm)
Density
(people per sqKm)
1 Mumbai India 14,350,000 484 29,650
2 Kolkata India 12,700,000 531 23,900
3 Karachi Pakistan 9,800,000 518 18,900
4 Lagos Nigeria 13,400,000 738 18,150
5 Shenzhen China 8,000,000 466 17,150
6 Seoul/Incheon South Korea 17,500,000 1,049 16,700
7 Taipei Taiwan 5,700,000 376 15,200
8 Chennai India 5,950,000 414 14,350
9 Bogota Colombia 7,000,000 518 13,500
10 Shanghai China 10,000,000 746 13,400
11 Lima Peru 7,000,000 596 11,750
12 Beijing China 8,614,000 748 11,500
13 Delhi India 14,300,000 1,295 11,050
14 Kinshasa Congo 5,000,000 469 10,650
15 Manila Philippines 14,750,000 1,399 10,550
16 Tehran Iran 7,250,000 686 10,550
17 Jakarta Indonesia 14,250,000 1,360 10,500
18 Tianjin China 4,750,000 453 10,500
19 Bangalore India 5,400,000 534 10,100
20 Ho Chi Minh City Vietnam 4,900,000 518 9,450
21 Cairo Egypt 12,200,000 1,295 9,400
22 Baghdad Iraq 5,500,000 596 9,250
23 Shenyang China 4,200,000 453 9,250
24 Hyderabad India 5,300,000 583 9,100
25 Sao Paulo Brazil 17,700,000 1,968 9,000
26 St Petersburg Russia 5,300,000 622 8,550
27 Mexico City Mexico 17,400,000 2,072 8,400
28 Santiago Chile 5,425,000 648 8,400
29 Singapore Singapore 4,000,000 479 8,350
30 Lahore Pakistan 5,100,000 622 8,200
31 Recife Brazil 3,025,000 376 8,050
32 Istanbul Turkey 9,000,000 1,166 7,700
33 Dalian China 2,750,000 389 7,100
34 Khartoum Sudan 4,000,000 583 6,850
35 Rio de Janeiro Brazil 10,800,000 1,580 6,850
36 Monterey Mexico 3,200,000 479 6,700
37 Bangkok Thailand 6,500,000 1,010 6,450
38 Osaka/Kobe/Kyoto Japan 16,425,000 2,564 6,400
39 Guadalajara Mexico 3,500,000 596 5,900
40 Athens Greece 3,685,000 684 5,400
41 Ankara Turkey 3,100,000 583 5,300
42 Madrid Spain 4,900,000 945 5,200
43 London UK 8,278,000 1,623 5,100
44 Tel Aviv Israel 2,300,000 453 5,050
45 Sapporo Japan 2,075,000 414 5,000
46 Buenos Aires Argentina 11,200,000 2,266 4,950
47 Moscow Russia 10,500,000 2,150 4,900
48 Barcelona Spain 3,900,000 803 4,850
49 Porto Alegre Brazil 2,800,000 583 4,800
50 Tokyo/Yokohama Japan 33,200,000 6,993 4,750
51 Belo Horizonte Brazil 4,000,000 868 4,600
52 Fortaleza Brazil 2,650,000 583 4,550
53 Warsaw Poland 2,000,000 466 4,300
54 Tashkent Uzbekistan 2,200,000 531 4,150
55 Naples Italy 2,400,000 583 4,100
56 Katowice Poland 2,200,000 544 4,050
57 Leeds/Bradford UK 1,499,000 370 4,050
58 Manchester UK 2,245,000 558 4,000
59 CapeTown South Africa 2,700,000 686 3,950
60 Fukuoka Japan 2,150,000 544 3,950
61 Taichung Taiwan 2,000,000 510 3,900
62 Baku/Sumqayit Azerbaijan 2,100,000 544 3,850
63 Curitiba Brazil 2,500,000 648 3,850
64 Birmingham UK 2,284,000 600 3,800
65 Berlin Germany 3,675,000 984 3,750
66 Riyadh Saudi Arabia 4,000,000 1,101 3,650
67 Campinas Brazil 1,750,000 492 3,550
68 Jeddah Saudi Arabia 2,750,000 777 3,550
69 Paris France 9,645,000 2,723 3,550
70 Durban South Africa 2,900,000 829 3,500
71 Vienna Austria 1,550,000 453 3,400
72 Accra Ghana 1,500,000 453 3,300
73 Glasgow UK 1,200,000 368 3,250
74 Nagoya Japan 9,000,000 2,875 3,150
75 Quito Ecuador 1,500,000 479 3,150
76 Donetsk Ukraine 1,400,000 451 3,100
77 Goiania Brazil 1,475,000 479 3,100
78 Munich Germany 1,600,000 518 3,100
79 Stuttgart Germany 1,250,000 414 3,000
80 Dublin Ireland 1,075,000 365 2,950
81 Kuwait Kuwait 1,600,000 544 2,950
82 Nizhni Novgorod Russia 1,500,000 505 2,950
83 Rome Italy 2,500,000 842 2,950
84 Phnom Phen Cambodia 1,500,000 518 2,900
85 Beirut Lebanon 1,800,000 648 2,800
86 Brasilia Brazil 1,625,000 583 2,800
87 Essen/Düsseldorf Germany 7,350,000 2,642 2,800
88 Lumumbashi Congo 1,200,000 427 2,800
89 Kuala Lumpur Malaysia 4,400,000 1,606 2,750
90 Los Angeles USA 11,789,000 4,320 2,750
91 Milan Italy 4,250,000 1,554 2,750
92 Pretoria South Africa 1,850,000 673 2,750
93 Stockholm Sweden 1,400,000 518 2,700
94 Turin Italy 1,350,000 500 2,700
95 Dubai UAE 1,900,000 712 2,650
96 Porto Portugal 1,035,000 389 2,650
97 Toronto Canada 4,367,000 1,655 2,650
98 Budapest Hungary 1,800,000 702 2,550
99 Lisbon Portugal 2,250,000 881 2,550
100 Johannesburg/East Rand South Africa 6,000,000 2,396 2,500
101 Rotterdam Netherlands 1,325,000 531 2,500
102 Harare Zimbabwe 1,750,000 712 2,450
103 Cologne/Bonn Germany 1,960,000 816 2,400
104 San Francisco/Oakland USA 3,229,000 1,365 2,350
105 Frankfurt Germany 2,260,000 984 2,300
106 Hamburg Germany 1,925,000 829 2,300
107 San Jose USA 1,538,000 674 2,300
108 Arabia Saudi 1,525,000 673 2,250
109 Brussels Belgium 1,570,000 712 2,200
110 Lille France 1,050,000 474 2,200
111 Helsinki Finland 1,000,000 479 2,100
112 Port Elizabeth South Africa 900,000 427 2,100
113 Sydney Australia 3,502,000 1,687 2,100
114 New York USA 17,800,000 8,683 2,050
115 Auckland New Zealand 1,050,000 531 2,000
116 New Orleans USA 1,009,000 512 1,950
117 Copenhagen Denmark 1,525,000 816 1,850
118 Montreal. Canada 3,216,000 1,740 1,850
119 Honolulu USA 718,000 399 1,800
120 Las Vegas USA 1,314,000 741 1,750
121 Miami USA 4,919,000 2,891 1,700
122 Ottawa/Hull Canada 828,000 490 1,700
123 Vancouver Canada 1,830,000 1,120 1,650
124 Antwerp Belgium 915,000 596 1,550
125 Denver USA 1,985,000 1,292 1,550
